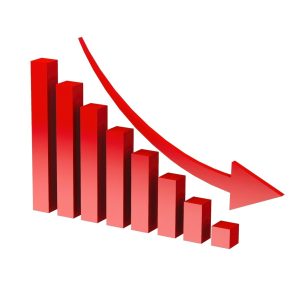
The bond market and in particular certain yield curves are starting to flash warning signs: 5s-30s inverted this week for the first time since 2006. This information is useful and not so useful depending on your time horizon.
Let’s answer why it’s useful first, it’s telling you in simple terms that growth will slow, and the probability of a recession just went up and the cycle that started in 2009 is coming to an end. Here’s the rub not even the smartest folk in the bond market can tell you when, it could be anywhere from 6-18 months.
What we can extrapolate currently is if we start to see US long end yields 10s and 30s stop going up here. The market has most likely priced in the rate hiking cycle. It’s always important to point out the market prices before the economy.
The impact of higher yields have already started to hit certain sectors of the economy. The jump in MBS 30Y fixed is currently sitting at 4.42% housing data has started to turn down as a result new home sales were down 2%.
Now the important part that matters most is how many hikes to kill inflation? All the talk of soft and hard landings, personally I don’t think they have a choice apart from 1994 every single hiking cycle led to a hard landing. I would be shocked if this is any different, as in 1994 inflation already peaked 2 years before, this is not the case today.
From recent speeches/interview, it’s clear that Fed members are now on the path to get more aggressive as they should. Next meeting they will most likely be hiking by 50bps. I would not expect them to stop until we see inflation has come under the 2% level. This can be accelerated if risk assets take a hit. It’s worth saying this will not stop the supply side to the inflation equation but will come through political will. Midterms are in November this year, keep an eye out for Keystone pipeline headlines.

FX
USD
Flight to safety continues as there’s still no resolution on UKR & RUS tension. DXY is hovering around where we were before the Covid crash happened at 99. This trend has coincided with the flattening of the yield curve expect steeping to reverse this trend after inversion.
JPY
The Yen has been following the moves in the US bond market tick by tick this has led to it trading outside of all the other majors shown in the chart above. I would expect mean reversion to kick in once we get a bid to ZN and margin calls on USDJPY shorts.
EUR
The louder the screams for parity for the EURUSD the more we jump. Depending your bias on the direction is whether your long-term view on the euro bloc as whole is more integration or not. Germany has started to not solely rely on the kindness of strangers by increasing their defense budget. This is in my view is bullish long term.
GBP
Cable has been flirting with 1.30 for a while, if that were to break, it leads to a lot of downside especially to catch up with the moves we have already seen in closely linked pairs like EURUSD. That break is not to be faded as it could be a retest to near Covid lows that other pairs have already tested.
CAD
The Loonie is still correlating to Oil the question to ask have we seen a top in crude at $130? If so expect some selling pressure to CAD especially if we start to see a growth panic.
AUD
AUD strength has come from its commodity output similar to some EM currency like BRL as the war rages on the flight to safety has been who can pick up the slack from lost supply in goods from Russia and Ukraine. This argument is logical. I would expect some pull back going forward as commodity prices peak.
CHF
CHF has sold off in March as rate differentials play a part. This has not been as extreme as other pairs such as JPY. The reason might be because of a seeking of safety from the Euro area and its neutrality towards war. I have no strong opinion either way currently other crosses may provide more volatility.
The post <h5>Macro Research</h5> <h3>The First Warning Signs</h3> appeared first on JP Fund Services.
Read More:
What is the best definition of economic data?
plataforma iphone de trading en forex