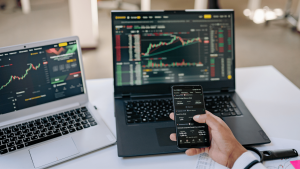
Technical indicators are widely used to track price movements and identify potentially profitable setups. The forex market is ever-dynamic, reacting to external and internal factors that influence the demand and supply of a currency pair. The positioning average indicator is an essential tool for creating a trading strategy. Let’s explore what it is, how it is derived, and how to use it in forex trading.
What Is the Positioning Average Indicator?
The positioning average indicator tracks and averages together the recent fair value gaps (FVG) initiation levels on a chart. FVGs describe a point where there is a market imbalance (inefficiency) relative to the asset’s fair value, which is believed to be a point of interest based on the premise that price moves to fill imbalances.
When using trading platforms, identifying an FVG on TradingView charts, for example, involves accurately determining the candlesticks and initiation levels. Candlesticks form in succession, with the wick or body of the successor touching the wick or body of the preceding candle.
However, when imbalances happen, price inefficiency is seen as a space created between a candle and the second successor, such that their bodies or wicks do not touch.
Getting the average of the FVGs that occur on a chart can indicate an area with the best potential price levels, indicating where the significant traders are positioned. The positioning average indicator is designed to identify the average of bullish and bearish FVGs so traders can, in turn, identify crucial support and resistance levels when trading.
How the Indicator Works
The positioning average indicator consists of lines, the bull and bear averages, displayed when the price is above or below the market.
When the price stays above the bull average FVG, traders can consider a resistance level. A support level occurs when the price remains below the bear average, and the market shows a downtrend. Sometimes, the bullish and bearish averages are displayed in the positioning average indicator. This happens when the market is ranging/consolidating, and both bulls and bears are pushing to dominate it.
The initiation level describes the specific point of the candle where an FVG begins and is a crucial characteristic. This is because the length and width of an FVG reveal the strength and likelihood of price reacting from there. The bigger the FVG, the more likely the price reacts from there. So, by averaging the FVGs on a chart, traders can identify the critical positions and trade based on the opportunities presented by the market.
Trading With Positioning Average
The key to trading with a positioning average is to treat the indicator as a support and resistance level indicator. There are three possible outcomes with trading FVGs average positioning:
- Trend reversal from a bearish or bullish trend (which then creates a support or resistance).
- Trend confirmation and continuation after a pullback. Pullbacks must be weak to respect the support or resistance level.
- Ranges/consolidation, where the price moves between the bullish or bearish averages with no clear direction.
A trading plan incorporating this strategy could look like this:
- Wait for clear and prominent FVGs to form, and use the indicator to average them.
- Identify the price in relation to the bullish or bearish average and mark the critical resistance and support lines.
- Wait for a pullback on the bullish or bearish average, enter the trade if the pullback is weak, and respect the line.
- If the pullback is vital, especially around large FVGs, wait for a retest of the level and then enter a trade in the opposite direction to ride the reversal.
- Trade the ranges or wait until the consolidation ends and the price breaks out in the bullish or bearish direction.
What To Watch Out for When Trading with Positioning Averages
When trading this strategy, specific situations impact the outcome of your trade. These are:
- Misjudging FVGs: Fair value gaps suggest the price might revert to fill the gap, but it’s not guaranteed. The price could continue through the gap, leading to drawdowns.
- Limited Opportunities: Fair value gaps aren’t frequent, especially in efficient markets. This can limit your trading opportunities with this strategy.
- Increased Drawdown Potential: Averaging into a position while the price falls against you increases your total potential loss.
- Margin Calls: A more prominent position due to averaging requires more capital for margin trades. A price drop can trigger margin calls, forcing you to close the trade.
- Volatility: This strategy is risky in volatile markets. Price swings can quickly erase gains and magnify losses.
- False Hope: Averaging down can create the illusion of control, leading you to hold onto losing positions for too long.
- Gap and Trend Mismatch: The fair value gap might not align with the overall trend. Averaging into a position against the trend can be very risky.
- False Breakouts: Fair value gaps can sometimes be false breakouts, and the price might reverse before you expect it. Averaging during a false breakout can lead to losses.

Creating a Trading Strategy for ROI
All strategies work correctly under favorable market conditions. When trading with the positioning strategy, the key to increasing ROI is a higher risk-to-reward ratio (RRR) and sound management. Potentially profitable FVG averages with a high RRR are excellent opportunities to layer up and increase your ROI.
The key is progressive entries, such as buying or selling the currency pair at pullbacks that continue the trend. Although increasing your lot size means a higher ROI, it is best to trade according to your plan and gradually increase your capital.
Combining fundamental and technical analysis for this strategy is essential for increasing ROI. The price reacts to market news, moving toward demand when traders decide based on events.
Using Positioning Average in Trading
The positioning average indicator is a free indicator built by LuxAlgo for the TradingView community. The indicator can be integrated into compatible platforms and used to average FVGs for enhanced trading. The strategy is based on the principle of FVGs forming resistance and support lines when averaged, helping traders identify potentially profitable setups as the price moves to correct the imbalances.
Tradersdna is a leading digital and social media platform for traders and investors. Tradersdna offers premiere resources for trading and investing education, digital resources for personal finance, market analysis and free trading guides. More about TradersDNA Features: What Does It Take to Become an Aggressive Trader? | Everything You Need to Know About White Label Trading Software | Advantages of Automated Forex Trading