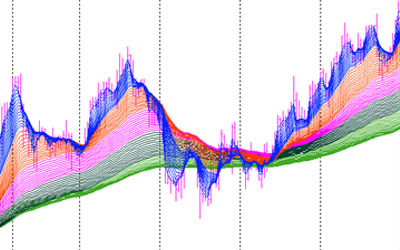
A moving average is a method for smoothing out price action over time, thereby eliminating some of the ‘noise’ to get a clearer picture of the trend. At any point in the smoothed-out line, the reading for the moving average is the average closing price for a currency pair over a certain number of periods. Here’s an example of what it looks like overlaid on a candlestick chart.
Source: FXstreet
As is the case with most other indicators, moving averages can ultimately be used to help you predict future prices. Looking at the slope of the moving average can give you a better idea of the potential future direction of market prices.
There are a few different types of moving average, each with their own level of ‘smoothness’. The smoother a moving average is, the slower it reacts to price movement, and the choppier it is, the quicker it reacts to price movement. The smoothness is largely dependent on the time period that is being sampled.
Simple Moving Averages
A simple moving average is calculated by adding up the closing prices over a certain period and dividing the result by the number of prices added together. So, if you plotted a 4 period simple moving average on a 1-hour chart, you would add together the closing prices for the last 4 hours, and divide that number by 4. This gives you the average closing price over the last four hours. Then, if you do the same calculation for each successive hour, and string the results together in a line, you will get a simple moving average for a 4-hour time period.
Similarly, if you were to do a 4-period simple moving average on a 10-minute chart, you would add up the closing prices of the last 40 minutes and then divide that number by 4. Or, if you were doing a 4-period simple moving average on a 30-minute chart, you would add up the closing prices of the last 120 minutes and divide that number by 4.
You may be pleased to learn that you don’t usually have to do this, as most charting packages will do all of these calculations for you. However, it’s important to know how they are worked out so that you can edit the indicator correctly. This means you can adjust and create different strategies too suit changing market conditions.
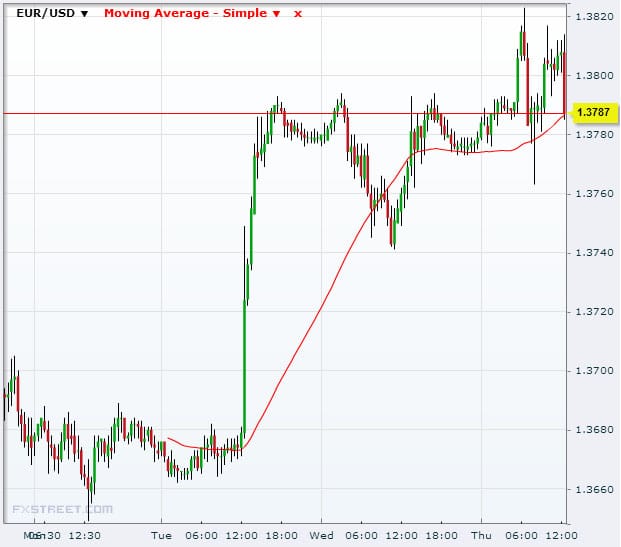
Moving averages operate with a delay, much like most other indicators. What you are seeing with a moving average is a smoothed-out echo of past price movements, which can hint at the general direction of future short term price action.
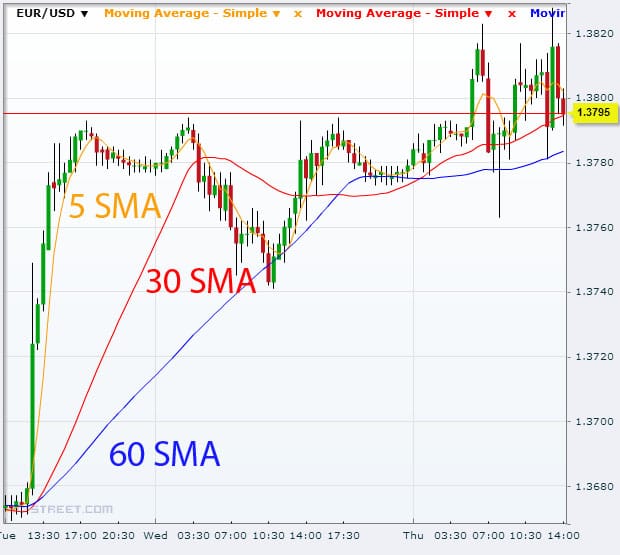
In the chart above, we’ve plotted three different SMAs – a 5-period SMA (orange), a 30-period SMA (red) and a 60-period SMA (blue). You’ll notice that the 60 SMA is further from the current price than the 30 and 5 SMAs.
The reason for this is that the 60 SMA adds up the closing prices of the previous 60 periods and divides that figure by 60 to get the reading. The longer the period for the SMA, the slower it will react to price movement.
What the SMAs in this chart show is that the market is trending upwards, albeit quite moderately after a big jump (which was prompted by the release of Nonfarm Payroll data, one of the biggest events in the forex calendar).
Moving averages give us a broader view of the market than could be achieved by merely looking at the current price data, giving us a general idea of where the market might be headed. SMAs tell us whether the a pair is trending up, trending down, or merely ranging.
Exponential Moving Average
One problem with SMAs is that they can be thrown off by price spikes, which can indicate that a trend is developing when in fact nothing is really happening. That’s why we might want to use an exponential moving average (EMA) instead.
Here is an example of what we mean by an SMA being thrown off by a spike, by plotting a 5-period SMA on a daily EUR/USD chart:
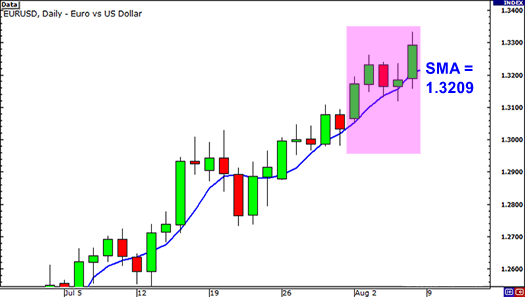
Here are the closing prices for the past 5 days (highlighted in the chart)
Day 1: 1.3172
Day 2: 1.3231
Day 3: 1.3164
Day 4: 1.3186
Day 5: 1.3293
We could work out a simple moving average by adding these together and dividing by 5, like so:
(1.3172 + 1.3231 + 1.3164 + 1.3186 + 1.3293) / 5 = 1.3209
However, if there was a news release on Day 2 that caused the euro to drop against the dollar and close at 1.3000, this might throw off our SMA. Let’s see if it does:
Day 1: 1.3172
Day 2: 1.3000
Day 3: 1.3164
Day 4: 1.3186
Day 5: 1.3293
We would calculate the SMA like so:
(1.3172 + 1.3000 + 1.3164 + 1.3186 + 1.3293) / 5 = 1.3163
This would give you the impression that the price was headed downwards, when in fact Day 2 was just a blip and the overall trend is in fact still upwards.
This is where the exponential moving average comes in, as it provides us with a way to filter out these spikes. What these do is to give more weight to the most recent periods in the sample.
In this case, it would put more weight on days 5, 4, and 3 than on 2 and 1. Therefore, the spike on Day 2 would have less of an impact on the moving average than it would on the simple moving average. This makes a lot of sense, as it puts more emphasis on the recent activities of traders, without completely discounting the slightly further past.
Let’s look at that take a look at a 1-hour chart of USD/JPY to show how an SMA and EMA might look alongside each other on a chart:
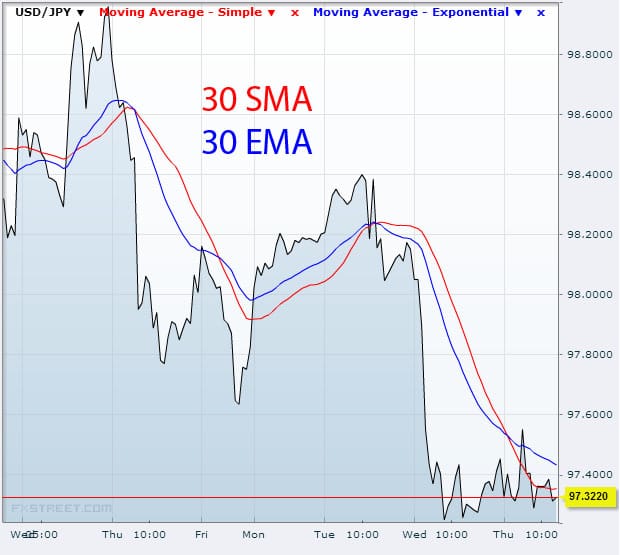
As you can see, the blue line (30 EMA) is closer to the the actual price than the red line (30 SMA). This means that the EMA more accurately represents recent price action, because it places more emphasis on what traders have been doing recently. This is a good thing, as generally speaking it is more important to see what traders are doing right now than what they were up to last week or last month.
SMA vs. EMA
So which one is better? It all depends on what you want the moving average to reveal to you. If you want something that will respond quickly to price action, a short-period EMA would be the best option. These will enable you to catch trends earlier, resulting in bigger profits, as the earlier you can catch a trend, the longer you can ride it for.
However, with an EMA, there is a greater chance of being given a false signal and getting the trend wrong, particularly during periods of consolidation. Because it responds quickly to the price action, you could think a trend is forming when in fact it is just a price spike.
The opposite is true of a simple moving average. If you want an average that is smoother and responds more slowly to price action, then a longer period SMA would be a better option. They are particularly useful over longer time frames, as they give you an idea of the overall trend. Although a long-period SMA is slow to respond to price action, it could prevent you from getting false signals indicating the start of a trend. However, there is the danger that it might delay for too long, and you miss out on the trend altogether.
Pros & Cons
Simple Moving Averages
Pros: Produces a smooth chart that eliminates most false signals or ‘fakeouts’.
Cons: Slow to react, causing a delay in buying and selling signals that could cause you to miss a trading opportunity
Exponential Moving Averages
Pros: Faster than SMAs, and better at showing recent price swings
Cons: More likely to mislead with false signals or ‘fakeouts’.
Which is better?
In most cases, traders will plot a few different moving averages to give them a more rounded picture of the current market situation. For example, they might use a long period simple moving average to determine the overall trend, and a shorter period exponential moving average to help them find a good time to enter trades.
In the second part of our series on Moving Averages, we shall be looking at how to use moving averages to determine the trend, how to incorporate the crossover of moving averages into your trading system, and how they can be used as dynamic support and resistance. In the meantime, why not try plotting some moving averages of your own using FXstreet’s free Advanced Charting tool, which we have used for some of the above examples.
Other articles in this series:
A forex trader’s guide to moving averages: Part 2
A forex trader’s guide to moving averages: Part 3
Tradersdna is a leading digital and social media platform for traders and investors. Tradersdna offers premiere resources for trading and investing education, digital resources for personal finance, market analysis and free trading guides. More about TradersDNA Features: What Does It Take to Become an Aggressive Trader? | Everything You Need to Know About White Label Trading Software | Advantages of Automated Forex Trading