If you’ve been following the forex market for a while, you’ll probably have noticed certain trends emerging. For example, you may have noticed that when a certain currency pair rises, another currency pair tends to fall. Or, you might have noticed that some currency pairs tend to rise and fall in tandem with each other.
This phenomenon is known as currency correlation – and it’s something that is essential for every forex trader to have a strong understanding of. In this series, we shall be looking at all the relevant aspects of currency correlation, such as how to calculate currency correlations, how to read a currency correlation table, and how to leverage this knowledge in your own trading activities.
What is currency correlation?
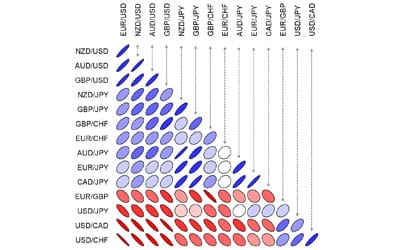
Source: FXstreet
In finance, the term ‘correlation’ specifically refers to a statistical measure of how two securities move in relation to each other. So, in the case of the forex market, currency correlation is a measure of the degree of similarity between the movements of two currency pairs.
One of the main reasons that currency pairs tend to show strong correlations is that each pair contains two currencies, so no pair is ever truly isolated from all the rest.
If you plan to trade more than one currency pair, it’s essential that you understand the relationship between various currency pairs, as currency correlations can directly affect your exposure to risk in any given trading situation. If you trade multiple currency pairs without fully understanding these concepts, you could end up losing a lot of money before you even realise what has gone wrong.
What does currency correlation look like?
Correlation is measured by a mathematical figure known as the correlation coefficient, which ranges between -1 and +1.
If two currency pairs move in perfect tandem with each other 100% of the time, then they would be said to have a correlation coeffficient of +1.
By the same token, if two currency pairs moved in the opposite direction to one another 100% of the time, they would be said to have a correlation coefficient of -1.
However, if the two currency pairs are completely independent from one another – ie, there is no relationship between their movements – then they would have a correlation coefficient of 0.
Currency Correlations Change
It’s important to note that while the relationships between currency pairs are quantifiable, they change over time due to changing sentiment and global economic factors. Therefore, it’s important to follow the shift in correlations over time, as pairs that exhibit a strong correlation today might not necessarily do so over a longer time frame.
As a rule of thumb, the six-month trailing correlation between two currency pairs is perhaps the most useful, as it gives you a useful reference point for shorter-term correlations, while retaining a close snapshot of recent market conditions.
There are many reasons why currency correlations change, but for the most part it is a result of diverging monetary policies, unique economic and political factors, and the sensitivity of a particular currency pair to commodity prices.
In the next part of our series, we’re going to look at how these correlations are calculated – and how to interpret the results in the form of a table.
Tradersdna is a leading digital and social media platform for traders and investors. Tradersdna offers premiere resources for trading and investing education, digital resources for personal finance, market analysis and free trading guides. More about TradersDNA Features: What Does It Take to Become an Aggressive Trader? | Everything You Need to Know About White Label Trading Software | Advantages of Automated Forex Trading


