Drawing support and resistance levels correctly is the key to many technical analysis techniques, but how do you do it? It all seems so easy on the perfect graphs that are often used in examples, but on real price charts, it’s as much an art as it is a science. Here, we’re going to give you some tips as to how to draw, choose, and trade more useful support and resistance lines.
 The first thing to think about when considering where to put your support and resistance levels is what the market is likely to do after hitting one of them. The three most likely outcomes are a retracement, a change in direction, or a stall. With this in mind, you might want to adapt your strategy by, for instance, moving your stop loss levels, adding to your trade, or closing your trade.
So how best to define support and resistance levels? Well, broadly speaking, a support level is a level that the market has rejected at least twice, and is keeping the market from reaching lower levels, and a resistance level is a level the market has rejected at least twice that is keeping the market from reaching higher levels.
If you’re following a purely technical analysis-based strategy, it’s not that important to know why the market is rejecting these levels. It could be due to an accumulation of buy orders at a support level or sell orders at a resistance level. It might be that buyers are attracted by the lower levels (support level) or sellers are attracted by the higher levels (resistance level). It could also be that buyers think the market will go higher (support) or that sellers think the market will go lower (resistance). Ultimately, there is no way to tell for sure why the market is topping or bottoming out at these levels – but it doesn’t really matter. What does matter is being able to predict what the market is most likely to do next so that you can profit from it.
When drawing support and resistance levels, there are three rules that you need to bear in mind:
1: The market must be rejected at least twice
2: The more times the market has been rejected from this level, the more important the level becomes
3: The most important rejections are the recent rejections.
Take a look at the following graph:
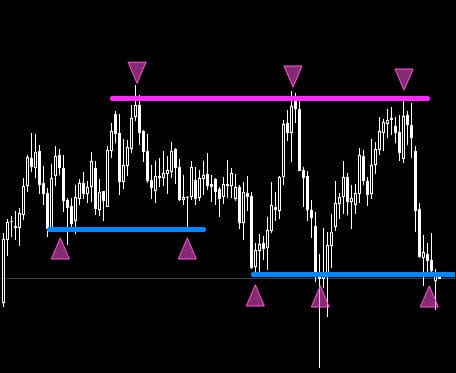
The resistance level (purple line at the top) is important because it shows that the market has been rejected three times from the same level. In the event that there was another resistance level near this with only two rejections, it would be less important than this one.
In this chart we have two support levels (in blue) with three rejections each. Because the one on the right is more recent, it is the most important of the two, and is therefore the only one you should consider.
In general, you only need to consider the support and resistance levels that the market is taking into consideration at that time, so you should always choose no more than one of each, staying consistent with the rules we have laid down. An important thing to remember is that support and resistance levels are not exact measurements, but are more like zones. So don’t worry about getting it at the very lowest low or the exact close of the candlestick – instead, just draw it where it touches the most rejections, and you will get a better idea of the trend.
Tradersdna is a leading digital and social media platform for traders and investors. Tradersdna offers premiere resources for trading and investing education, digital resources for personal finance, market analysis and free trading guides. More about TradersDNA Features: What Does It Take to Become an Aggressive Trader? | Everything You Need to Know About White Label Trading Software | Advantages of Automated Forex Trading


