
The Aroon indicator, created by technical analysis guru and author Tushar Chande, is an indicator that can be used to determine the likely direction of a forex pair across several different timeframes. It was introduced by Chande back in 1995, but despite its effectiveness, has remained relatively obscure in comparison with his other, more popular indicators such as the Momentum Oscillator.
What is the Aroon indicator?
This indicator is composed of two lines known as Aroon up and Aroon down, which show market direction. In some ways, it is a similar type of indicator to the directional movement index (DMI), which was pioneered by J Welles Wilder, and that could be one of the reasons why it has failed to take off in a big way.
‘Aroon’ is a word in Sanskrit that means “dawn’s early light”, a reference to the fact that the Aroon indicator acts as an early-warning system for trend changes.
In practice, the two lines are each given a value of between 0 and 100. Aroon up shows the upward strength in the market, while Aroon down shows the downward strength. Together, they indicate whether the market is likely to move up or move down. It works best as a filter, to help you decide whether or not to pursue a particular trade. For example, if you are considering a long trade, but the Aroon up is not above the Aroon down, then you might not want to pursue that trade. Similarly, you should only pursue a short trade when Aroon down is above Aroon up.
Aroon oscillator strategy
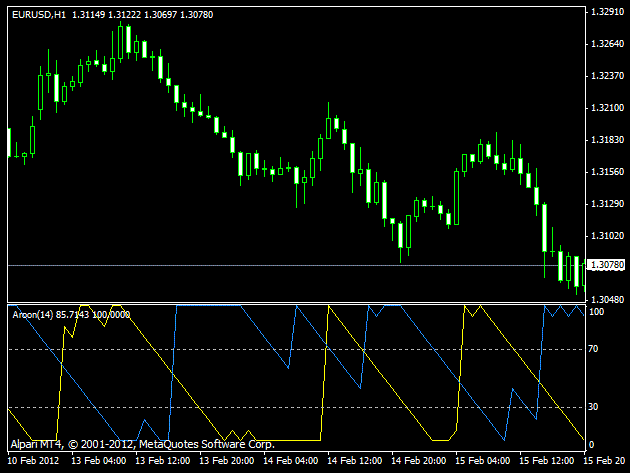
You can also use the Aroon as a type of oscillator to check whether the market is trending or not. During a range-bound market, both the Aroon lines (up and down), will be close together and both lines will show low readings.
When Aroon up is above 70, it means there is a very strong trend, while indicates a very strong trend taking place, anything below 50 indicates a weakening trend, and anything below 30 and the market probably isn’t in a trend.
Therefore, you should enter long trades when Aroon up is above 70, and if the line drops below 50, the position should be reduced. If the Aroon up drops below the Aroon down, you should close the position.
You can apply the same strategy with short trades, using the Aroon down line. Short trades should be entered when Aroon down is above 70, you should start scaling out when it drops below 50, and if the line crosses below Aroon up then the trade should be closed.
Tradersdna is a leading digital and social media platform for traders and investors. Tradersdna offers premiere resources for trading and investing education, digital resources for personal finance, market analysis and free trading guides. More about TradersDNA Features: What Does It Take to Become an Aggressive Trader? | Everything You Need to Know About White Label Trading Software | Advantages of Automated Forex Trading