Yesterday, we explained what the US Dollar Index is, and how it is calculated. Because it’s an average of various currency pairs, rather than a currency pair in itself, it can’t be traded directly – although there are some derivatives that will allow you to speculate on its movements. However, that’s not to say it’s useless from a spot forex trading perspective – far from it, in fact. Here’s why…
The USDX – An Invaluable Indicator
As you are no doubt aware, the US Dollar is used in the vast majority of forex transactions, forming one half of several of the most traded currency pairs such as EUR/USD, GBP/USD, and USD/JPY.
If you trade any pairs that involve the USD, then the USDX can prove to be one of the most useful tools at your disposal. And even if you don’t, it still provides you with an idea of how strong the US dollar is around the world, as it can have a knock-on effect on cross-currency pairs that don’t involve the USD. And, when the market outlook is unclear for the US dollar, the USDX can often provide you with a clearer – and broader – picture.
As well as being an indicator of the US dollar’s general strength around the world, it is a particularly useful indicator for trading the EUR/USD pairing. This is unsurprising when you consider that the USDX is weighted more than 50% towards the EUR/USD exchange rate, but you might be surprised at just how inversely related the EUR/USD and the USDX are. Look at these two charts for example:
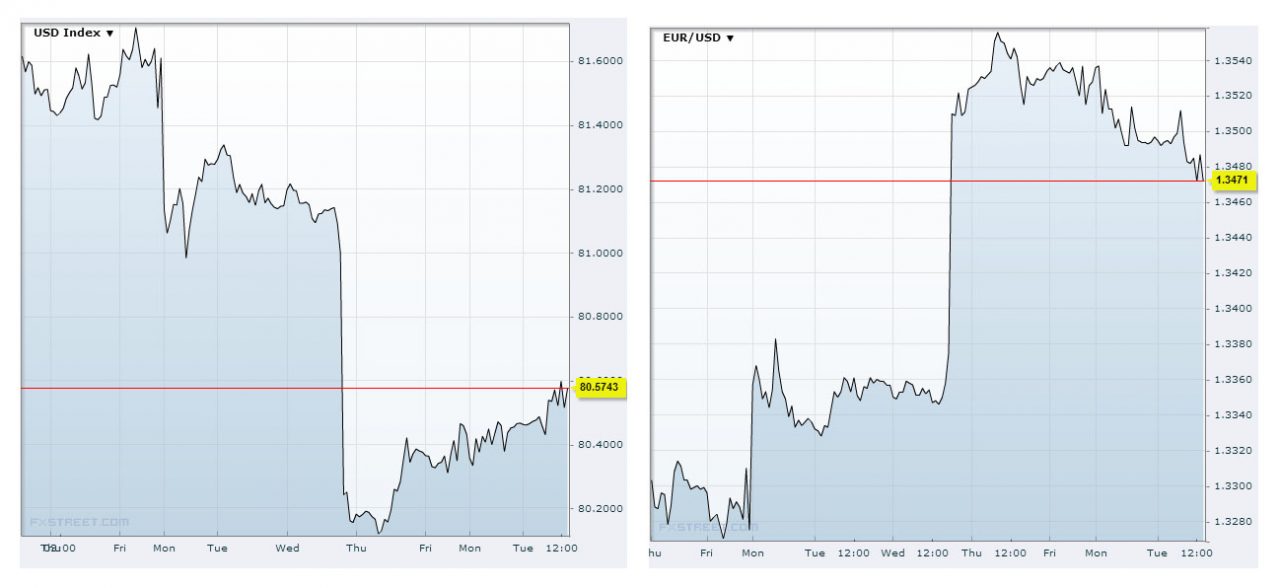
Source: FXstreet
As you can see, when one goes up, the other one goes down. While it isn’t an exact mirror image, it’s uncannily close. This makes the USDX a very helpful indicator for trading EUR/USD. In general, if the USDX moves significantly, you can reasonably expect the market to react accordingly. It’s a two way thing, because spot currency traders react to the USDX, and the USDX reacts to the activities of spot currency traders.
This makes it useful for spotting breakouts, as breakouts in spot USD pairs usually result in the USDX moving in a similar breakout fashion, and vice versa.
Basically, the USDX acts as a key indicator for the direction of the USD, so if a currency pair containing the USD has moved, you can refer to the USDX to see if this is more a result of a change in the global strength of the USD or a change in the relative strength of the other currency in the pairing.
So, if the USDX is on the up, a strengthening USD will show as a downtrend on the EUR/USD chart. By the same token, if you are trading a pair such as the USD/CHF, where the USD is the base currency, a fall in the USDX will usually result in a fall in the corresponding USD/CHF charts, as we can see in the example below.
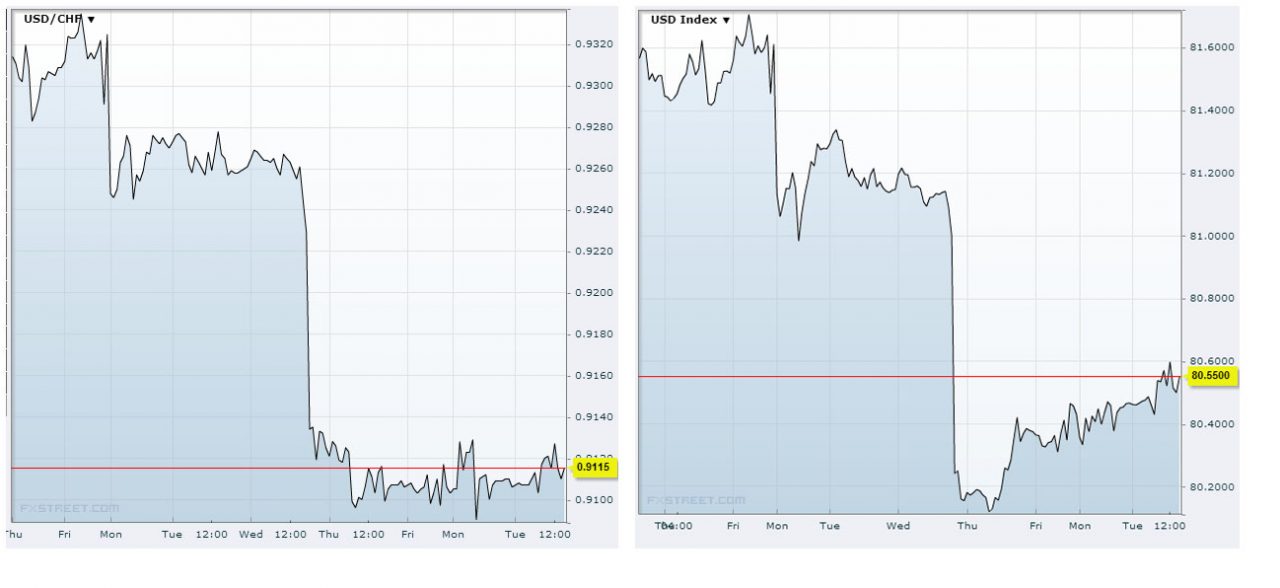
Source FXstreet
Basically, if the USD is the base currency (eg USD/CHF) then the USDX and the currency pair should move in the same direction, and if the USD is the quote currency, the USDX and the currency pair should move in opposite directions.
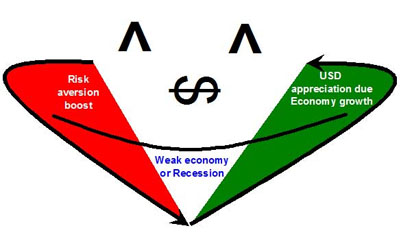
The Dollar Smile Theory
The Dollar Smile Theory is an explanation, authored by former Morgan Stanley currency strategist and economist Stephen Jen, for the phenomenon of the dollar strengthening during economic extremes, and weakening at points between these extremes. So, when the economy is booming, the dollar tends to strengthen, but it also seems to do this during times of economic crisis.
This theory is based around three different scenarios that can affect the direction of the US dollar, as in this illustration:
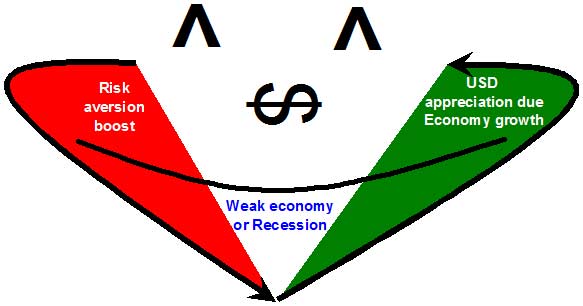
Source: forexpeacearmy.com
Scenario 1 (Red): This part of the smile curve shows the US dollar is benefiting from times of economic crisis, which leads to risk aversion in the markets with investors placing their money into ‘safe haven’ currencies such as the yen and the US dollar. Even though the US economy might be weak, the US dollar is considered less risky than higher-yielding assets, and is therefore considered a safer store of value during these times.
Scenario 2 (White): When the economy is in the grip of a recession, the dollar value is undermined by weak fundamentals in the US economy and the possibility of interest rate cuts. This leads to the market shying away from the dollar in favour of higher-yielding currencies and assets.
Scenario 3 (Green): During periods of strong economic growth, investors become more optimistic and the dollar begins to strengthen. Expectations of interest rate increases, coupled with stronger fundamentals cause the dollar to appreciate.
The most recent example of this occurred in 2007, when the financial crisis kicked off and the dollar got a huge boost, as in scenario 1. This transpired into a recession, which bottomed along with the dollar value in 2009 as investors migrated to higher-yielding currencies – as in scenario 2. At present, the US economy is not going through a boom time, but if this does transpire, we can expect to see scenario 3 manifest itself.
Ultimately, all economies are cyclical – the key is to determine which part of the cycle the economy is at the moment. The Dollar Smile Theory, when used in conjunction with the US Dollar Index, can provide a good indication of where the dollar, and the associated currency pairs, might be headed in the longer term.
Previous Articles in This Series:
The US Dollar Index Explained – Part 1
Read More:
Tradersdna is a leading digital and social media platform for traders and investors. Tradersdna offers premiere resources for trading and investing education, digital resources for personal finance, market analysis and free trading guides. More about TradersDNA Features: What Does It Take to Become an Aggressive Trader? | Everything You Need to Know About White Label Trading Software | Advantages of Automated Forex Trading