
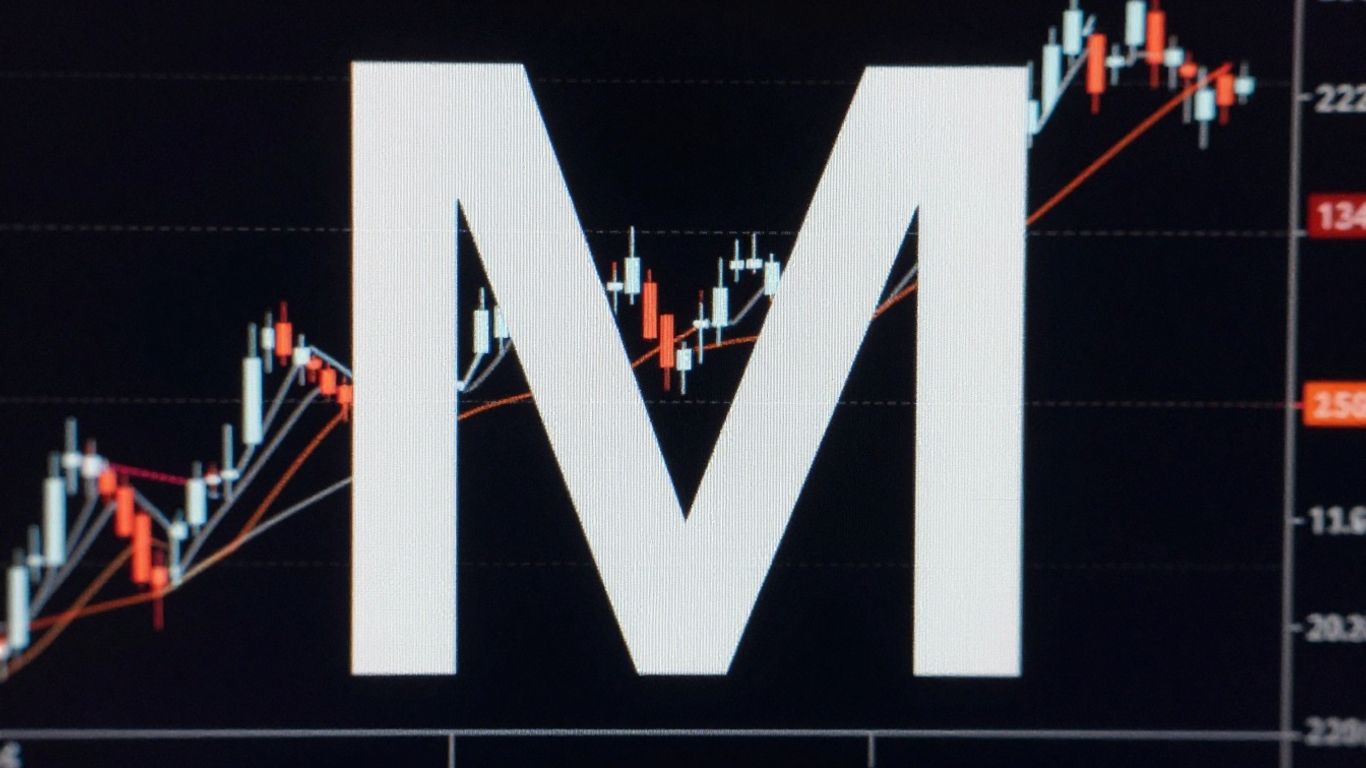
The M pattern, also known as a double top, is a chart formation that traders watch for when an uptrend might be losing steam. It looks like the letter ‘M’ on a price chart, showing two peaks where the price tried to go higher but couldn’t quite make it. Learning to spot this pattern and trade it can really help you figure out when a market might start moving down. We’ll walk through how to find it, how to trade it, and some common mistakes to avoid so you can get better at m pattern trading.
Key Takeaways
- The M pattern, or double top, is a bearish reversal signal that appears after an uptrend, indicating buyers might be losing control.
- To spot an M pattern, look for a strong uptrend, a first peak, a pullback, a second peak that fails to make a new high, and then a break below the neckline (the low between the peaks).
- When trading an M pattern, wait for the price to break below the neckline for confirmation before entering a short trade, and set your stop-loss above the second peak.
- Confirming the M pattern with volume (declining at the second peak, increasing on the breakdown) and other indicators like RSI or MACD can improve trade accuracy.
- Common mistakes include entering trades too early, ignoring volume and the overall trend context, and expecting perfect symmetry in the pattern’s peaks.
Understanding the M Pattern in Trading
So, you’re looking to get a handle on the M pattern? It’s a pretty common sight on trading charts, and for good reason. Basically, it looks like the letter ‘M’ and it often pops up after prices have been climbing for a while. Think of it as the market taking a breather, maybe even getting a little tired, after a good run up.
What Constitutes an M Pattern?
An M pattern, sometimes called a double top, is a chart formation that suggests a potential shift from an upward trend to a downward one. It’s not just about the shape, though. It’s about what’s happening with the price action. You’ll see the price hit a high point, then pull back a bit, then try to go up again but fail to reach that first high. After that second failed attempt, the price usually drops below the low point it made between the two highs. That low point is often called the "neckline."
Here’s a breakdown of how it typically forms:
- First Peak: The price reaches a high after an uptrend, then pulls back. This is the first ‘hump’ of the ‘M’.
- Trough/Neckline: The price finds a temporary support level between the two peaks. This is the bottom dip of the ‘M’.
- Second Peak: The price attempts to rise again but stalls out before reaching the height of the first peak. This is the second ‘hump’, and it’s lower than the first.
- Breakdown: The price falls and breaks through the neckline support level, confirming the pattern.
The failure of the second peak to make a new high is a key signal.
The Psychology Behind the M Pattern
Markets aren’t just numbers; they’re driven by people, and people have feelings. The M pattern really shows this. Initially, during the uptrend leading to the first peak, buyers are feeling pretty good, pushing prices up. But when the price pulls back from that first peak, some traders start to take profits. This creates a bit of uncertainty. Then, when the price tries to rally again for the second peak, but can’t quite get there, it shows that the buyers who were so eager before are losing their nerve. Sellers start to see an opportunity, and when the price finally breaks below that neckline, it’s a clear sign that the sellers have gained the upper hand and the mood has shifted from optimistic to cautious, or even bearish.
When you see an M pattern forming, it’s like the market is telling you that the buyers’ energy is running out. They tried twice to push prices higher, and both times they couldn’t quite make it. This often means the trend is about to change direction.
M Pattern as a Bearish Reversal Signal
So, why is this pattern important? Because it’s a strong indicator that an uptrend might be ending and a downtrend is about to begin. It’s a signal that the buyers who were in control are losing their grip, and the sellers are stepping in. It’s not a guarantee, of course, no pattern is. But it’s a heads-up that the market’s mood is changing, and it might be time to think about adjusting your strategy from looking for buys to looking for sells.
Identifying the M Pattern on Your Charts
So, you’ve heard about the M pattern and want to know how to actually spot it when you’re looking at your trading charts. It’s not as complicated as it might sound, but it does require a bit of patience and careful observation. Think of it like looking for a specific shape in the clouds – once you know what to look for, you start seeing it everywhere.
Spotting the Initial Uptrend
First things first, an M pattern doesn’t just pop up randomly. It typically forms after a period where the price has been moving steadily upwards. You’ll see a clear, sustained move higher. This initial uptrend is the foundation upon which the M pattern is built. Without this preceding bullish move, what looks like an M might just be a random fluctuation.
Recognizing the First Peak and Pullback
After that upward climb, the price will hit a high point – that’s your first peak. It’s like the market taking a breather. Buyers who have been in the trade might start cashing in some profits, causing the price to pull back a bit. This pullback creates a temporary dip, a sort of valley, before the price potentially tries to go higher again. This is the first part of the "M" shape.
Confirming the Second Peak’s Failure
Now, here’s where things get interesting. The price attempts to rally again, trying to reach new highs. However, if it fails to surpass the height of that first peak, you’ve likely found the second peak of your M pattern. This failure to make a new high is a really important clue that the upward momentum might be running out of steam. Buyers are trying, but sellers are stepping in more strongly now, preventing the price from going any higher. You might notice that the volume on this second push higher is also lower than on the first peak, which can be another sign of weakening buyer interest.
Waiting for the Neckline Break
The final piece of the puzzle is the neckline. Remember that pullback after the first peak? The low point reached during that pullback often forms a support level, which we call the neckline. After the second peak fails, the price will usually start to fall again. You need to wait for the price to decisively break below this neckline. This break is the confirmation that the M pattern is complete and signals a potential shift from an uptrend to a downtrend. It’s the moment when sellers seem to have taken control. It’s tempting to jump in as soon as you see the second peak, but waiting for that neckline break is key to avoiding false signals and improving your chances of a successful trade. You can often find good information about chart patterns like this on sites dedicated to technical analysis.
Here’s a quick rundown of the steps:
- Observe the Uptrend: Look for a clear period of rising prices.
- Identify the First Peak: Note the initial high point and the subsequent pullback.
- Spot the Second Peak: See if the price attempts to rise again but fails to exceed the first peak.
- Confirm the Neckline Break: Wait for the price to fall below the support level formed by the pullback.
Don’t get too hung up on perfect symmetry. Real-world M patterns aren’t always perfectly shaped like the letter ‘M’. Focus more on the price action – the two peaks at similar levels and the failure of the second peak to make a new high, followed by a break of the support level.
Executing Trades with the M Pattern

So, you’ve spotted that tell-tale "M" shape forming on your chart. That’s great! But now comes the real test: turning that observation into a profitable trade. It’s not just about seeing the pattern; it’s about knowing when and how to act. Patience is definitely your best friend here. Rushing in before the pattern is fully confirmed is a common mistake that can cost you.
Entry Strategies After Neckline Confirmation
The moment of truth for an M pattern trade is the break of the neckline. This is the support level that formed between the two peaks. You don’t want to jump the gun. Wait for the price to actually close below this neckline. This gives you a solid signal that the sellers have taken control and the bearish reversal is likely underway. Some traders like to enter immediately on the close, while others might wait for a small pullback after the break to get a slightly better price. Either way, the confirmation is key.
- Wait for the close: Don’t enter a short trade until the price has closed below the neckline.
- Consider a retest: Sometimes, the price will bounce back up to the neckline after breaking it. This can offer a second entry opportunity, but only if it fails to hold above the neckline again.
- Volume check: Look for an increase in trading volume as the price breaks the neckline. This adds conviction to the move.
Setting Effective Stop-Loss Levels
Once you’re in a trade, you need to protect your capital. That’s where your stop-loss comes in. For an M pattern short trade, the logical place to set your stop-loss is just above the second peak. This gives the trade a bit of breathing room in case of minor price fluctuations, but it also means that if the pattern fails and the price starts moving significantly higher, you’re out of the trade quickly with a controlled loss. A well-placed stop-loss is non-negotiable for managing risk.
Determining Profit Targets with Measured Moves
Now, where do you aim to take your profits? A popular and effective method is using a "measured move." Here’s how it works:
- Measure the height: Take the vertical distance from the neckline to the highest point of either peak.
- Project the distance: Subtract that measured distance from the neckline break point.
This gives you a calculated price target for the potential downward move. It’s a good way to set realistic expectations and avoid getting greedy. You can also look at previous support levels on the chart as potential profit targets. Remember, it’s often better to take profits and miss out on a little extra than to hold on too long and watch your gains disappear.
The M pattern, often called a double top, is a visual representation of buyer exhaustion. After two attempts to push prices higher, the market shows it can’t sustain the upward momentum, paving the way for a potential downtrend. Waiting for the price to break below the support level, known as the neckline, is the critical confirmation signal for traders looking to enter a short position.
Combining this pattern with other technical tools can really boost your confidence. For instance, checking if momentum indicators like the RSI are also showing bearish divergence can strengthen your trade setup. It’s all about building a case for your trade rather than relying on a single signal. You can find more information on chart patterns like this on pages discussing chart patterns.
Enhancing M Pattern Trading Accuracy
So, you’ve spotted a potential M pattern. That’s great, but how do you make sure you’re not just seeing things? We need to add some layers to this to really boost your chances of success. It’s not just about the shape on the chart; it’s about what’s happening behind the scenes with the money and the mood of the market.
The Role of Volume Confirmation
Volume is like the chatter of the market. When you see an M pattern forming, pay attention to how much trading is happening. Usually, you’ll see volume pick up as the price goes up to make the first peak. Then, as the price pulls back, volume might drop a bit. The real confirmation comes when the price tries to make that second peak. If the volume is lower on this second attempt compared to the first, it’s a strong sign that buyers are losing steam. When the price finally breaks below the neckline, you want to see volume increase. This shows that sellers are stepping in with conviction.
Here’s a quick look at what to expect:
| Pattern Stage | Typical Volume Action |
|---|---|
| First Peak Formation | Moderate to High Volume |
| Pullback | Declining Volume |
| Second Peak Formation | Lower Volume than First Peak |
| Neckline Break | Increasing Volume (confirming bearish move) |
Combining M Patterns with Other Indicators
An M pattern is good, but it’s even better when other tools agree. Think of it like getting a second opinion. Indicators like the Relative Strength Index (RSI) or the Moving Average Convergence Divergence (MACD) can give you more clues.
- RSI: Look for bearish divergence. This happens when the price makes a higher second peak, but the RSI makes a lower peak. It suggests that the upward momentum is weakening, even if the price is still climbing a bit.
- MACD: Watch for the MACD line crossing below the signal line, especially if it happens around the second peak or during the neckline break. This can signal a shift in momentum to the downside.
- Moving Averages: If the price is struggling to get above a key moving average (like the 50-day or 200-day) at the second peak, it adds another layer of resistance to the pattern.
Considering Market Sentiment and Psychology
Beyond the numbers, what’s the general feeling in the market? The M pattern itself tells a story of buyer exhaustion. Buyers get excited, push the price up, take some profits, try to push it up again, and then fail. This failure at the second peak is where confidence starts to waver. Sellers see this weakness and start to take control.
When you see an M pattern, it’s often a sign that the previous buying enthusiasm is running out of gas. The market has tried to go higher twice and couldn’t quite make it. This hesitation can be a big signal that a trend might be changing direction, and it’s time to think about protecting your gains or looking for short opportunities.
Don’t just look at the chart in isolation. Think about what news might be coming out, or if there’s a general mood of caution among investors. Sometimes, even if the pattern looks perfect, a strong piece of positive news could override the bearish signal. Conversely, bad news can make a weak M pattern even more potent.
Common Pitfalls in M Pattern Trading
Even with a solid understanding of the M pattern, it’s easy to stumble. Lots of traders make the same mistakes over and over, and that can really eat into your profits. Let’s talk about some of the most common traps so you can avoid them.
The Danger of Premature Entry
This is a big one. You see the M pattern starting to form, maybe the first peak and pullback look good, and you think, "Okay, this is it!" So you jump in early, maybe shorting right after the first pullback. The problem? The pattern isn’t confirmed yet. The price could easily turn around, make a higher second peak, and blow right past your entry. Waiting for the price to break decisively below the neckline is non-negotiable for confirmation. Anything before that is just speculation.
Ignoring Volume and Trend Context
Volume is like the heartbeat of the market. When you see the second peak forming, if the volume is still high, it suggests buyers are still pretty determined, even if they couldn’t make a new high. A decrease in volume on that second peak, however, is a much stronger signal that buying interest is fading. Also, remember that M patterns typically form after an uptrend. If you’re seeing something that looks like an M in the middle of a strong downtrend, it’s probably not a reliable bearish reversal signal. Always consider the bigger picture.
Chasing Perfect Symmetry vs. Price Action
Charts aren’t always neat and tidy. You might see an M pattern where the two peaks aren’t exactly the same height, or the trough isn’t perfectly centered. Some traders get hung up on this, thinking the pattern isn’t valid if it’s not a perfect "M." Don’t fall into that trap. Focus more on the price action itself – specifically, the failure of the second peak to make a new high and the subsequent break of the neckline. The exact shape is less important than what the price is actually telling you.
Here’s a quick rundown of what to watch out for:
- Premature Entry: Shorting before the neckline break.
- Ignoring Volume: Not checking if volume decreases at the second peak.
- Ignoring Trend: Trying to trade an M pattern in the wrong overall market direction.
- Perfectionism: Getting stuck on exact symmetry instead of price action.
It’s easy to get excited when you think you’ve spotted a pattern. But in trading, patience often pays off more than speed. Rushing into a trade before all the signs are there is a fast way to lose money. Stick to your plan and wait for the confirmation signals.
Advanced M Pattern Trading Tactics
Risk Management for M Pattern Trades
When you’re trading the M pattern, managing your risk is super important. It’s not just about spotting the pattern; it’s about protecting your cash. A good rule of thumb is to place your stop-loss just above the second peak. This gives the price a little wiggle room in case of minor fluctuations, but it still keeps you safe if the pattern fails. You don’t want to get stopped out by noise, right? Also, figure out your position size before you even enter. Base it on the distance between your entry point and your stop-loss. This way, you know exactly how much you could lose on any given trade, which is key for keeping your overall portfolio healthy.
Adapting Strategies to Different Timeframes
The M pattern can show up on any chart, from a 5-minute chart to a weekly chart. But how you trade it might change a bit depending on the timeframe. On shorter timeframes, like hourly charts, you might see more M patterns, but they can also be a bit noisier, meaning more false signals. You’ll probably want to use tighter stop-losses and maybe aim for smaller, quicker profits. For longer timeframes, like daily or weekly charts, M patterns tend to be more reliable. The moves are usually bigger, so you can afford to give your trade a bit more space and aim for larger profit targets. It’s all about adjusting your expectations and your risk parameters to fit the timeframe you’re watching. Remember, a confirmed M pattern on a weekly chart is a much bigger deal than one on a 15-minute chart.
Integrating M Patterns into a Broader Trading Plan
Look, the M pattern is a great tool, but it shouldn’t be the only thing you rely on. Think of it as one piece of a bigger puzzle. You need to combine it with other things you’re already doing. For instance, does the M pattern appear after a clear uptrend? That’s a good sign. What about volume? Usually, you want to see volume drop at the second peak and then pick up when the price breaks below the neckline. That adds extra confirmation. You can also use other indicators, like the RSI or MACD, to see if they agree with the bearish signal. It’s about building a case for your trade, not just taking a shot in the dark. A solid trading plan includes rules for when to take a trade, when to exit, and how much risk you’re willing to take, and the M pattern fits right into that framework. It’s about making sure your trades are high-probability setups, not just random guesses. You can find more details on identifying these formations in this guide to M pattern trading.
Don’t get too hung up on perfect symmetry. While textbook M patterns look like a perfect ‘M’, real-world charts are messy. Focus more on the price action itself – the failure of the second peak to make new highs and the subsequent break of the support level. That’s the real story.
Wrapping Up Your M Pattern Journey
So, we’ve gone through what the M pattern is, how to spot it on a chart, and some solid ways to trade it. Remember, it’s not just about seeing the shape; it’s about understanding what’s happening in the market when it forms. Buyers get tired, sellers step in, and that break below the neckline is usually your cue. Don’t forget to use stop-losses to protect yourself and maybe look at other indicators to back up your trade. Like anything in trading, practice is key. Keep looking at charts, keep trying to find these patterns, and you’ll get better at it. Happy trading out there!
Frequently Asked Questions
What exactly is an ‘M’ pattern in trading?
Think of the ‘M’ pattern like a shape you see on a price chart that looks like the letter ‘M’. It usually shows up after prices have been going up for a while. This pattern suggests that the upward move might be ending and prices could start going down instead.
How can I spot an ‘M’ pattern on my charts?
To find an ‘M’ pattern, look for the price to make a high point, then dip down a bit, and then try to go up again but fail to reach the first high. This creates the two tops of the ‘M’ with a dip in the middle. You also need to see the price drop below the low point between the two tops – this is called the neckline.
When is the best time to start a trade if I see an ‘M’ pattern?
It’s super important to wait for proof before you trade. The ‘M’ pattern is confirmed when the price breaks below that middle dip, the neckline. Only then should you think about making a trade, like betting that the price will go down.
What’s a good way to manage my risk with ‘M’ patterns?
To keep your money safe, set a ‘stop-loss’ order just above the second high point of the ‘M’. This way, if the price suddenly goes up instead of down, you won’t lose too much. Also, figure out where you want to take your profits *before* you enter the trade.
Can I just use the ‘M’ pattern by itself to make trading decisions?
While the ‘M’ pattern is a helpful clue, it’s best not to rely on it alone. Think of it like using other tools, such as checking the trading volume (how many shares are being traded) or using other indicators like the RSI or MACD, to get more confirmation before you trade.
What are some common mistakes traders make with ‘M’ patterns?
A big mistake is jumping into a trade too early, before the price actually breaks the neckline. Another error is not paying attention to the trading volume, or ignoring the overall market trend. Also, don’t expect the two tops of the ‘M’ to be perfectly identical; focus on the price action itself.


