


In the first part of our series on Forex Trading with Fibonacci Ratios, we explained how Fibonacci derived these ratios from an Indian number sequence dating back to the sixth century, and outlined how these might be used by a forex trader. Today, we’re going to look in more detail at one of the most useful technical analysis tools at a trader’s disposal: Fibonacci Retracements.
Fibonacci Retracement
Fibonacci Retracement levels are percentage values that are widely used by traders to predict the length of corrections in a market that is trending. The most popular levels used by Forex traders are 38.2%, 50%, and 61.8%.
The level that you use very much depends on the strength of the trend. For example, if the trend is weak, the currency price might retrace by as much as 61.8%, whereas in a strong trend you would expect a minimum retracement of 38.2%. However, in general, the 50% retracement level is the most widely monitored of the three, being a common area for buying uptrends or selling downtrends.
In the event that a correction exceeds one of the retracement levels, there is a good chance that it will go to the next one, so if it passes the 38.2% level it should go to 50%, and if it passes 50% it should go to 61.8%. When the price retraces more than 61.8% of the previous move, you will usually see the price return to the beginning point of the trend before it reverses.
The basic strategy with Fibonacci retracements is to go short (sell) on a retracement at a Fibonacci-derived resistance level when the market is trending down, and go long (buy) on a retracement at a Fibonacci-derived support level when the market is trending up.
Finding these retracement levels involves identifying the significant recent Swing Highs and Swing Lows. In the case of a downtrend, for example, you would click on the Swing High and drag the line down to the most recent Swing Low, as in figure 1 below. You would do the opposite in an uptrend, clicking on the Swing Low and dragging the line to the most recent Swing High. Once you have drawn the line, the charting software will automatically calculate the Fibonacci retracements for you.
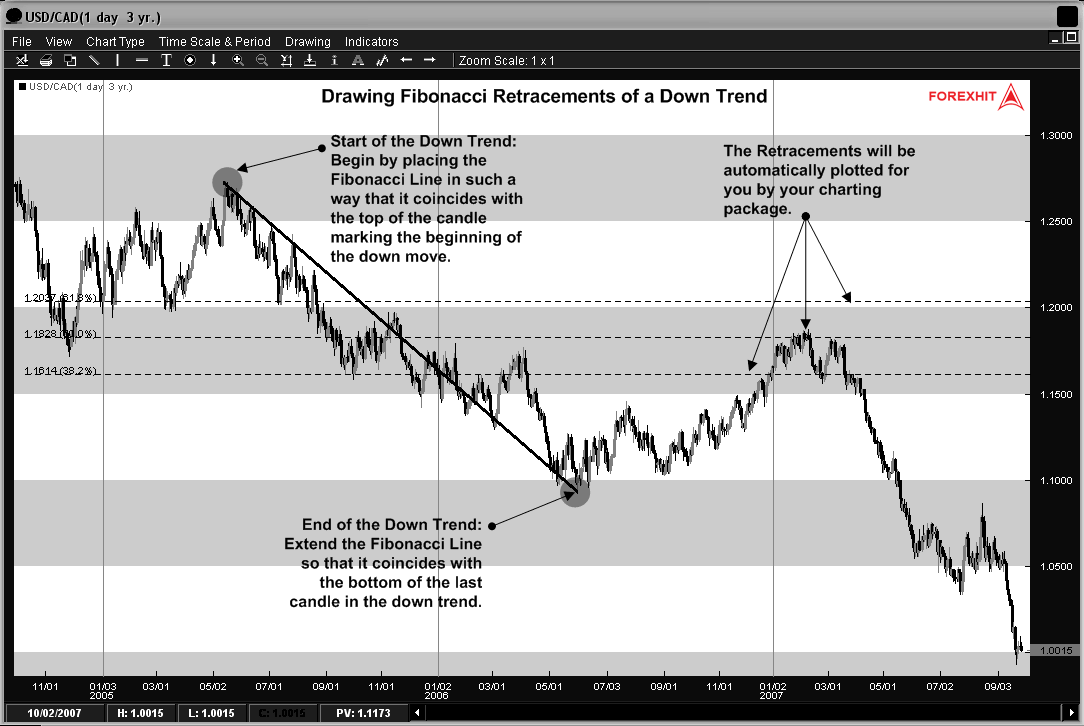
Source: forexhit.com
As we can see from the chart above, the retracement levels were 1.2037 (61.8%), 1.1828 (50%) and 1.1614 (38.2%). In this case, the price passed the 38.2% level before finding resistance on the 50% level. The reason the price action reverses at this level is because the majority of traders will have placed sell orders at this level as the price begins to rise again after the downtrend.
Now let’s look at another example – this time, with an uptrend.
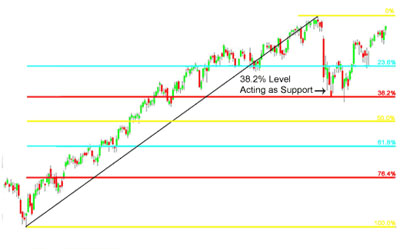
As we can see, the price pulled back through the 23.6% level, finding support at the 38.2% level before resuming the upwards move. So, as we can see, placing a buy order at the 38.2% level would have resulted in quite a profitable trade.
While it is true that prices will tend to change direction around these levels, this obviously isn’t true in every case. Therefore, it’s better to think of them as areas of interest, rather than guarantees of directional changes. If they were, traders would always place their orders at these levels, and the markets would remain in a perpetual state of trending.
One thing that can be guaranteed is that support and resistance levels will eventually break. Because the Fibonacci tool can be used to find these levels, the same applies to Fibonacci levels. Here, we’re going to look at an example of this:
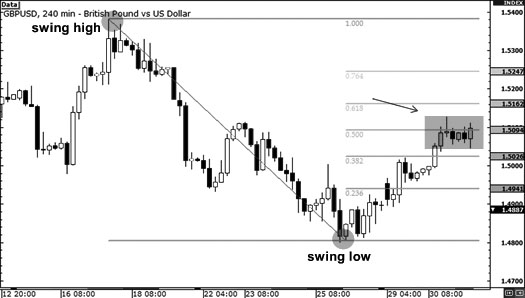
As you can see, the pair has been in a downtrend, so the Fibonacci tool is used to determine a good entry point based on a Swing High at 1.5383 and a Swing Low at 1.4799.
Because the pair has stayed at the 50.0% Fibonacci level for a few candles, the natural assumption is that the downtrend will resume and the price will start falling again. This is a common cue for placing a short trade order, but it doesn’t always work out that way, as we shall see in the following chart:
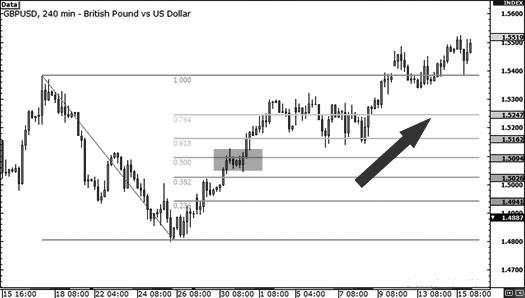
In this case, the Swing Low actually represented the bottom of the downtrend, and the price began an extended rally from this point on. If you had placed a short trade in this case, you would have lost money, especially if you were trading on margin and had failed to place an appropriate stop-loss to manage your risk.
The lesson to be learned from this is that while Fibonacci levels can provide you with a higher probability of success than merely guessing where to place your trade orders, this approach doesn’t always work.
Prices do not always reverse to the 38.2% level before resuming a trend – they might carry on to the 50% or 61.8% levels before they turn around, or they might just break through all the levels like in the above example. The market will not always resume a trend after finding temporary support or resistance, and could continue to go past the recent Swing High or Swing Low.
Other articles in this series:
Forex Trading with Fibonacci Ratios: Part 1
Tradersdna is a leading digital and social media platform for traders and investors. Tradersdna offers premiere resources for trading and investing education, digital resources for personal finance, market analysis and free trading guides. More about TradersDNA Features: What Does It Take to Become an Aggressive Trader? | Everything You Need to Know About White Label Trading Software | Advantages of Automated Forex Trading


