


Fibonacci ratios have many uses for a forex trader, particularly if your strategy is weighted towards technical (as opposed to fundamental) analysis. In this series, we shall be explaining what these ratios are, and how to use them to improve your analysis – and ultimately your trading performance. While there are many esoteric uses for Fibonacci ratios in forex trading, we shall be concentrating on the two most widely-used Fibonacci-based tools: extensions, and retracements.
About Leonardo Fibonacci

Source: Wikipedia
Italian mathematician Leonardo Fibonacci is widely considered to be one of the pivotal figures in the development of mathematics. His biggest achievement was the development of what has become known as the ‘Fibonacci’ sequence, which begins with 0 and 1, and then the subsequent numbers are equal to the previous two added together:
0, 1, 1, 2, 3, 5, 8, 13, 21, 34, 55, 89, 144, 233, 377 etc…
So, the third number in the sequence is calculated by adding the first two (0+1) to give an answer of 1. Then, the fourth number is calculated by adding the second and third numbers (1+1) to give an answer of 2, and the fifth is the sum of the third and fourth numbers (2+1), giving an answer of 3. This sequence can be carried on infinitely, with the pace of growth increasing with every new step in the sequence.
Source: Wikipedia
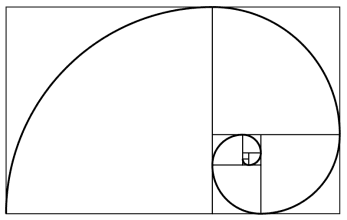
In this book, Fibonacci used the sequence to describe the population growth of rabbits in idealised circumstances. As it turned out, the sequence had a startling number of parallels with the way things worked in nature, such as the arrangement of branches along the stems of plants, the spirals in seashells, flowers, and cloud formations (see figure 1), and the veins in leaves. Although he didn’t mention it in Liber Abaci, it also has a relationship to the ‘Golden Ratio’, an important formula in mathematics and the basis of a long-held ideal of aesthetic perfection in the arts, including architecture, visual art, and music.
There is also a second ratio – that between alternate numbers. For example, 34 divided by 89 is equal to 0.382, and so is 144 divided by 377. These two ratios (0.618 and 0.382) are known as the “golden mean”, and are very important from a technical analysis point of view. You don’t really need to know how to work them out, as your charting software will do that for you – all you need to remember is a few numbers:
Fibonacci Retracement Levels
0.236, 0.382, 0.500, 0.618, 0.764
Fibonacci Extension Levels
0, 0.382, 0.618, 1.000, 1.382, 1.618
Fibonacci retracement levels are used by traders as potential support and resistance areas. Although there is some mathematical basis for using these numbers, the main reason that they are useful is because they have become a self-fullfilling prophecy, because so many traders use them to determine support and resistance levels, on which their trade orders are often based.
Fibonacci extension levels are widely used as profit taking levels, and because of the self-fulfilling nature of these levels due to their widespread use, this tool tends to work on a surprisingly consistent basis.
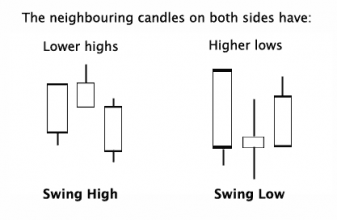
Fibonacci retracement and extension level tools are common features in most charting packages, but in order to apply them to your charts, you need to identify Swing High and Swing Low points (see figure 2, right).
A Swing High is a candlestick with at least two lower highs on both the left and right of itself, while a Swing Low is a candlestick with at least two higher lows on both the left and right of itself.
In the next installment, we shall be taking a closer look at Fibonacci retracement levels, and how they can be used in your trading. See you then!
Tradersdna is a leading digital and social media platform for traders and investors. Tradersdna offers premiere resources for trading and investing education, digital resources for personal finance, market analysis and free trading guides. More about TradersDNA Features: What Does It Take to Become an Aggressive Trader? | Everything You Need to Know About White Label Trading Software | Advantages of Automated Forex Trading


