
While intraday market volatility in the forex market tends to have no rational basis or predictability, except across very short time frames, the longer-term price swings in the currencies market are more obviously affected by economic factors. The most noticeable effects come as a result of the release of certain numbers contained within economic reports, which are known as economic indicators. These indicators, which are the basis of any fundamental analysis strategy for trading forex, are distinct from the mathematical indicators used in technical analysis, which are calculated purely on the basis of past price data and movements.
 Before the internet revolutionised the trading map for independent online investors, professional day traders and economists had the advantage of receiving the data contained in these economic reports minutes or hours before everyone else. But while this is still true to a limited extent, in that some traders might get the information a few fractions of a second before everyone else, everyone with an internet connection can now see these numbers within seconds of their release, which levels the playing field somewhat. And as we saw in yesterday’s guide to trading one of the most important economic indicators, the Nonfarm Payroll, the market is usually so volatile in the minutes after the news release that it is best to wait until this volatility has subsided before trading the data.
While the effect of these economic indicators on prices can be unpredictable, it is still worth having an idea of how you might ordinarily expect the market to react, so that if it contradicts this, you can examine the reasons why it might have done so. To help you to understand these, here is a guide to the most important economic indicators, where they can be found, and how the market tends to interpret them.
These all pertain to the U.S. economy, as the USD is involved in the vast majority of all currency trades, and has a huge knock-on effect on currency pairs that do not involve the USD. However, we shall cover key economic indicators from other countries in a future article. To view an example report, and gain access to the most recent editions, simply click on the name of the report that you are interested in.
Beige Book
Released: 2pm EST, two Wednesdays before every Federal Open Market Committee (FOMC) meeting, 8 times per year
 This is an discussion-based, rather than data-based, economic indicator consisting of commentary from business owners and economists in various regions of the U.S. Because of this, it has little short-term impact on prices, although it can be useful to gain insight into the data that Fed members have at their disposal, and their opinion on likely future trends.
Business Outlook Survey
Released: 12pm EST, Third Thursday of the month
This report, which is published by the Philadelphia Federal Reserve, is a monthly survey of manufacturing purchasing managers in Pennsylvania, New Jersey, and Delaware. Figures below zero indicate contraction in the manufacturing sector, whereas figures above zero indicate expansion. It’s one of the most watched regional manufacturing reports because it is released before the end of the month, and along with the Chicago NAPM index, tends to show a high correlation with the upcoming PMI report. It isn’t a big market mover in itself, but if there is a large percentage change, it can affect the positions taken by traders prior to the PMI release.
Consumer Confidence Index (CCI)
Released: 10am EST Last Tuesday of each month
This survey of over 5,000 US households intends to show the financial health, spending power, and confidence of the average American consumer. It consist of three headline figures – the Index of Consumer Sentiment, which reflects how people currently feel, Current Economic Conditions, which reflects how people feel the economy is going, and the Index of Consumer Expectations, which reflects how they think the economy will be in six months time. Despite the subjectivity of this survey, it can be a big market mover on the forex markets, because the confidence of consumers is key to the economic performance of a country as a whole, and therefore directly affects the value of its currency.
Consumer Credit Report
Released: 3pm EST, About five weeks after month’s end
This monthly Fed report estimates changes in the dollar amounts of outstanding unsecured loans to individuals, which tend to be used to purchase consumer goods. funds which are mainly used to purchase consumer goods. It’s not a big market mover, but it can be a good indicator of the future spending levels of consumers, and can therefore be used to inform traders of the positions they should take when trading the Personal Consumption and Retail Sales reports.
Consumer Price Index (CPI)
 Released: 8.30, Monthly, approximately mid-month
This is the main benchmark for inflation in the US economy, covering the prices across a basket of commonly bought consumer goods and services such as groceries and haircuts. It is perhaps the most important economic indicator there is, because it is always taken into account in Fed decisions, and because it is used to make adjustments to cashflow mechanisms such as pensions, Medicare, and cost of living adjustments to insurance policies.
Durable Goods Report
Released: 8.30am EST On or around the 20th of each month (advance release; revised release about six weeks after period end with Factory Orders)
The Durable Goods Report, which is released by the US census bureau, consists of data on new orders from thousands of manufacturers of durable goods, which are higher-priced goods with a useful life of over three years such as cars, consumer electronics, and turbines. Rises in this number usually occur ahead of general economic expansion, although sample error can affect the figure considerably so it is best to consider a moving average that takes into account previous releases when evaluating these results.
Employee Cost Index (ECI)
Released: 8.30am, last Thursday of April, July, November and January
The Employment Cost Index (ECI) is a quarterly report that reflects changes in wages, bonuses, and benefits from the previous quarter on a per-hour basis. Because employee costs are such a large part of corporate expenditure, they will often be reflected in the price of goods and services. Therefore, it can be used to gain an insight into future inflation trends, and can be a major market mover if it deviates from analysts’ estimates.
Employment Situation Report
Released: 8.30am EST, First Friday of the month
 This broad-based indicator, released by the Bureau of Labor Statistics (BLS), consists of two surveys. The “establishment survey”, which samples over 400,000 businesses, presents important statistics such as non-farm payrolls, hours worked, and hourly earnings. The “household survey” samples over 60,000 households to produce a figure representing the total number of individuals out of work, from which the national unemployment rate is derived. As we stated in yesterday’s article, the non-farm payrolls figure is one of the most hotly anticipated and widely traded indicators among forex traders. The other most eagerly-awaited number here is the unemployment figures from the household report, which are considered a lagging indicator of the health of the economy. The report as a whole is perhaps the most influential in determining Fed policy, and if the figures surprise analysts, it can move markets in a very dramatic way.
Existing Home Sales
Release Date: 8.30am EST Fourth week of the month
This report from the National Association of Realtors shows the number of existing (as opposed to new-build) homes that were closed during the month, the average selling price, and the length of time it is currently taking to sell off the entire housing inventory. These figures represent the aggregate demand among consumers for housing. This report, when used in conjunction with the Housing Starts report, can be a good leading indicator for the general health of the economy.
Factory Orders Report
Released: 8.30am EST, First week of the month
This report combines the Durable Goods Report with information about non-durable goods sales such as food and clothing. It is less vague than the Durable Goods report, but because much of the information is already known, it doesn’t tend to move the market much upon its release, although the inclusion of forward-looking data such as inventory and new orders makes it an important leading indicator for forecasting GDP.
Gross Domestic Product (GDP)
Released: 8.30am EST – advance release: four weeks after quarter ends; Final release: three months after quarter ends
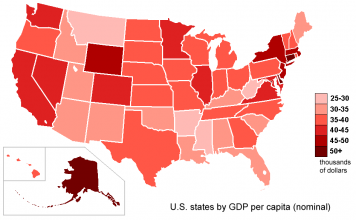 This is the most widely quoted and most influential economic indicator there is, representing the market value of all goods and services produced by the economy of the country being measured on a quarterly basis. While the results are conclusive, and form a vital part of any analysis of economic trends, it is not very timely, with much of the information contained within the report already being known ahead of its release. Nonetheless, it is a figure that every trader should have a deep understanding of if they are to be successful in analysing the markets.
Housing Starts
Released: 8.30am EST, On or around the 17th of the month
This report is the result of a survey of homebuilders across the US that measures the amount of housing starts, which are considered the laying of foundations for new homes, and approved building permits. These are leading indicators for the health of the construction industry and the economy as a whole, and while the report rarely sends shockwaves around the markets, the figures are useful for estimating other consumer-based indicators, as people buying new homes also tend to spend money on other consumer goods such as furniture and appliances.
Industrial Production
Released: 9.15 EST On or around the 16th of the month
This Fed report provides the monthly raw volume of goods produced by industrial firms such as factories, mines and electric utilities in the US, as well as newspaper, periodical and book publishing. It is useful as a leading indicator for inflation as industry is the first to feel supply shortages for basic materials, which drive up prices all the way down the supply chain. While the shift away from industrial production towards a service economy in the West means that the relevance of this figure is declining, it is often one of the first indicators of an inflection point in the trajectory of the economy as a whole.
Jobless Claims Report
Released: 8.30am EST Thursdays
This seasonally-adjusted indicator shows the number of initial filings for state jobless claims across the US. Because it is issued weekly, it provides an almost real-time account of the health of the economy. Although positve results rarely have much of an impact on the markets, a surprisingly negative result can have a huge, and often unexpected, impact across the board.
Money Supply
Released: 4.30pm EST every Thursday
This is an indicator of the amount of money that is floating around the economy and available for spending. Because it is released every week, no single release ever causes much in the way of short term market movements, there is a clear relationship between the money supply, inflation, and GDP growth, so it is worth considering as part of a wider evaluation of the economic climate.
Mutual Fund Flows
Released: During market hours, about four weeks after month’s end
This report shows the amount of money that is flowing into or out of mutual funds at any given time. Many analysts see a high figure as a ‘false positive’, in that influxes of money into mutual funds tend to peak just before the market does. However, an increase in times of recession can be an indicator that the economy is on the road to recovery. Although they are not a hugely important indicator, in that they cover only one part of the financial sector, they can be a good gauge of investor sentiment.
Non-Manufacturing Report
Release Date: 10am EST, third business day of the month
This report, which is issued monthly by The Institute for Supply Management (ISM) is a useful indicator of the health of the service sector, which is much larger than the manufacturing sector. Although it is a relatively new indicator, having been introduced in 1998, it is very timely and consistent, and is fast gaining influence among traders as a key indicator of the broader health of the economy.
Personal Income and Outlays
Released: 8.30am EST 4-5 weeks after month’s end
The Personal Income and Outlays Report is issued by the Bureau of Economic Analysis (BEA) every month, providing insights into consumer behavior and total economic consumption. The two headline figures, income and outlays, are measured in dollar terms, and are considered two of the most influential indicators in terms of the future direction of the economy, even more so than the Consumer Price Index (CPI). However, because it is released so late, it rarely moves the market in a big way, as much of the information has been anticipated by the market using other, more timely indicators.
Producer Price Index (PPI)
Released: 8.30am EST Second or third week of the month
This is a weighted index of prices measured at the wholesale, or producer level from the Bureau of Labor Statistics (BLS), excluding imports. The most important number in this report is the PPI Industry Index (finished) figure, which concerns final stage manufacturing prices, minus the volatile food and energy components. It is a valuable leading indicator for inflation (ie the CPI numbers), and encouraging results can have a positive impact on the markets.
Productivity Report
Release Date: 8.30am Approx five weeks after previous quarter’s end
This quarterly report measures the level of output achieved by businesses per unit of labour, using previously-released GDP and labour figures. Productivity gains have historically led to gains in real income, lower inflation, and increased profitability at a corporate level. Because it is derived from already-extant data, this release usually has little impact on the markets, although they can be useful to investors as they provide the answers to complex calculations that might be difficult and/or time consuming to do on their own.
Purchasing Managers Index
Released: 10am EST, First business day of the month
The PMI is the headline indicator for the monthly report report issued by the Institute for Supply Management (ISM). It is derived from five sub-indicators, namely Production Level, New Orders, Supplier Deliveries, Inventories, and Employment Level, and is an important sentiment indicator for manufacturing and the economy as a whole. A rating of 50 or higher indicates that industry is expanding, and by association so should the economy. A rate of 42 or above indicates that the GDP is likely to expand, whereas a rating below this indicates that a recession may be on the way. It is a very timely leading indicator for GDP and BLS reports, particularly when used in conjunction with more data-driven indicators such as the PPI and GDP or the ISM Non-Manufacturing Report.
Retail Sales Report
Released: 8.30am EST on or around the 13th of the month
 This is one of the most keenly anticipated numbers among economists and investors, tracking the dollar value of merchandise sold within the retail trade, sampling both fixed point-of-sale and non-store retailers of all sizes. There are two headline figures here, the total sales figure (and percentage change from the previous month), and the “ex-autos” figure, which discounts auto sales, which can skew the overall figure due to the high prices and historical seasonality. It is a good predictor of inflationary pressure, and has a large bearing on Fed policy, and it can therefore be a big market mover, particularly if it differs greatly from analysts’ estimates.
Trade Balance Report
Released: 8.30am EST around the 19th of the month
This is an important one for forex traders, as it is widely used by investors and policy makers to determine the health of the US economy and its relationship with the rest of the world. The headline figure here is the nominal trade deficit, which represents the current dollar value of U.S. exports minus imports. The US has run a trade deficit for over 20 years now, and this is not necessarily a bad thing as long as the deficit is balanced by an equal dollar amount of foreign investment in U.S. assets – mainly treasuries. This means that, when interest rates are low, US debt becomes less attractive, causing the value of the dollar to drop in comparison with other currencies. If the data in the Trade Balances report is markedly different to previous reports, it can move the markets in a profound way. While the report is notoriously difficult to estimate, partly due to the high volatility of oil prices, it can give valuable clues as to future changes to GDP that are not explained by internal consumption and production.
Wholesale Trade Report
Release Date: 10am EST on or around the 9th of the month
This monthly survey of around 4,500 wholesalers in the US presents three headline numbers: monthly sales, monthly inventories, and the inventory to sales ratio. This data is divided into durables and non-durables, and between eight and ten industries. The inventories-to-sales (I/S) is the most keenly anticipated number for analysts and investors, and is considered a lagging indicator for the Durable Goods Report, which is released earlier in the month, highlighting any imbalances in supply and demand. The ratio usually reaches its peak in the middle of a recession, and when it starts to decline it can be an indicator that the economy is on the road to recovery. It doesn’t move the markets much upon its release, but it is quite useful as a predictor of GDP figures.
Tradersdna is a leading digital and social media platform for traders and investors. Tradersdna offers premiere resources for trading and investing education, digital resources for personal finance, market analysis and free trading guides. More about TradersDNA Features: What Does It Take to Become an Aggressive Trader? | Everything You Need to Know About White Label Trading Software | Advantages of Automated Forex Trading