Information is a viable tool in navigating the crypto world. Here are the summaries of price actions, in-depth analysis, and predictions of important digital assets.

BITCOIN (BTC)
On May 22, Bitcoin started a fresh increase from the $28,500 support zone against the US Dollar. Bitcoin formed a double bottom pattern near $28,500 and climbed higher. The price traded above the $30,000 level and the 100 hourly simple moving average. There was a key bullish trend line formed with support near $29,800 on the hourly chart of the BTC/USD pair (data feed from Kraken). Bitcoin price remained well bid above the $28,500 support zone.
On May 24, Bitcoin traded at $29.2k, the Premier cryptocurrency Bitcoin was down 3.6% during the day and 26% over the month. During the past 7 days, Bitcoin tested the $31k on multiple occasions but failed to cross the price mark as it served as the strong resistance.
Bitcoin started a fresh increase after it tested the $28,500 support zone on Wednesday. The price traded above the $29,500 level and the 100 hourly simple moving average. There was a break above a major bearish trend line with resistance near $29,800 on the hourly chart of the BTC/USD pair. A fresh base was formed near $28,600.
On May 26, Bitcoin retested the key $28,500 support zone against the US Dollar as the bulls made a move towards the $30,600 resistance. Bitcoin price remained well bid above the $28,500 support zone. There was a fresh increase initiated from the $28,635 swing low and the price climbed above $29,000.
Going into the weekend, the world’s largest cryptocurrency Bitcoin (BTC) has been under constant selling pressure and failing to hold around the $30,000 resistance. Earlier on Friday, the Bitcoin price crashed under $29,000 dropping another 2.5 percent. With the fall, Bitcoin showed a clear divergence and decoupling from stock.

ETHEREUM (ETH)
As the week opened, ETH price progressively inclined showing a bearish absence. Ethereum price displayed reasons to believe in a price spike to $2400. Nevertheless, the Ethereum price hints that a countertrend spike will occur as the bears seem to be uninterested in suppressing the price further on the daily chart.
On Wednesday, Ethereum failed to clear the $2,085 resistance and declined against the US Dollar. The price traded below $2,000 and the 100 hourly simple moving average. There was a break below a key bullish trend line with support near $2,000 on the hourly chart of ETH/USD. Ethereum attempted to clear the $2,085 and $2,100 resistance levels. However, ETH failed to gain strength and formed a short-term top near the $2,085 level.
On Friday, Ethereum extended its decline and tested the $1,920 support against the US Dollar. Ethereum remained stable above the key $1,920 support zone. There was a break above a major bearish trend line with resistance near $1,980 on the hourly chart of ETH/USD. Ethereum extended decline after it broke the $1,950 support and the 100 hourly simple moving average. However, the bulls took a strong stand near the $1,920 support. A low was formed near $1,911 and the price started a recovery wave.
On Saturday, Ethereum extended its decline below the $1,820 support against the US Dollar. ETH tested $1,730 and remains at a risk of more downsides in the near term. Ethereum gained bearish momentum and declined below $1,820. The price traded below $1,800. There was a key bearish trend line formed with resistance near $1,910 on the hourly chart of ETH/USD. The pair struggled and remained at a risk of more losses below $1,700.
Going into the new week, Ethereum’s price recovered from its slump and made a comeback above $1700.
Analysts believe Ethereum’s price is on track to a bullish target of $10,000. Ethereum blockchain has witnessed a drop in on-chain activity. Despite the slump, Ethereum’s price recovered from its downtrend and climbed above the $1700 level.

RIPPLE (XRP)
In the first two days of the week, Ripple’s price had set up equal lows around $0.398 and tagged this level thrice over the past nine days, The run-ups after these swing lows created lower highs.
On Wednesday, Ripple’s price was set to trade back above $0.50 as sentiment shifted in favor of bulls. XRP price was on a trajectory to rally at least 20%. XRP price looked disconnected from the correlation and instead appeared to be displaying bullish signs to the market in what looks like a classic pennant breakout with plenty of tailwinds behind it. Expect to see XRP price tick $0.48 and possibly stretch to $0.50, booking gains of 20%.
On Friday, the XRP price disappointed investors the most within the cryptocurrency market. The Ripple price broke away from a consolidative triangle pattern, sending the XRP price to revisit $0.38. Still, analysts are looking for ways to forecast an alternative uptrend scenario ahead of the upcoming news event between XRP and the SEC.
XRP price could continue its erratic nature for days to come. The long-held dispute between the two forces is likely the only thing holding XRP price from reaching $1.00 and beyond. A dollar-cost average approach is still a favorable strategy for XRP maximists aiming for long-term macro targets.

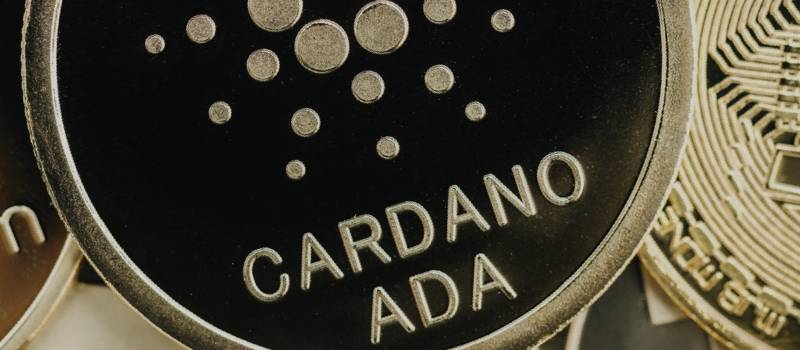
CARDANO (ADA)
At the beginning of the week, Cardano’s price faced immense selling pressure combined with a lack of volatility as it approached the $0.487 to $0.614 range’s midpoint at $0.551. ADA failed to sustain a rally and break the key resistance as the price was dangerously close to critical support. ADA attempted to rally on Monday, but the price was quickly pushed back to the key support at $0.50. The important resistance was at $0.60, and Cardano only managed to test this level once when it was sharply rejected
On Tuesday, Cardano’s price action continued to dip lower and lower, following the broader market in a continued downtrend.
On May 26, 2022, Cardano dipped below the $0.50 support level over the past few hours. Cardano’s price prepared for a retest of $0.80. ADA price, like several cryptocurrencies, hovered around the initial sell-off price that occurred on May 12th. Cardano’s situation was very similar to Ethereum, with its price falling below the key support at $0.50. This turned the bias bearish, and the next support is found at $0.39. For this reason, ADA had a difficult week, closing the past seven days in the red with a 14.2% loss.
The cryptocurrency might fall lower before attempting a recovery in the coming days. Buyers seem less likely to come to the rescue at present, particularly when the key support level is much lower than the current price. Looking ahead, ADA has to do its best to not close a daily candle below $0.39. This was the all-time high from May 2018 and was also confirmed in January 2021 before ADA rallied towards $3. A loss of this critical level would take ADA into a severe correction exceeding a 90% price drop from its current all-time high.

SOLANA (SOL)
On 23 May 2022, Solana’s price steadily moved toward its short-term target at $77.98. Solana’s price has been consolidating above a stable support level for nearly two weeks and is slowly climbing higher. Patient investors can capitalize on this steady climb to crucial hurdles.
Solana’s price faced an intense sell-off at $141.59 aka the 50% retracement level of the range extending from $66.19 to $216.98. This sell-off received an extra boost on April 4 as bulls failed to move above the range’s midpoint at $141.59. Solana’s price steadily moved toward its short-term target at $77.98.
Solana’s price has been consolidating above a stable support level for nearly two weeks and is slowly climbing higher. Patient investors can capitalize on this steady climb to crucial hurdles. Solana’s price faced an intense sell-off at $141.59 aka the 50% retracement level of the range extending from $66.
Solana did not manage to stop the downtrend on Friday, and the price fell below the important support at $44. The cryptocurrency is on a path to re-test the critical level at $37. SOL has lost 21.8% of its valuation in the past seven days, making it the worst performer on our list. The downtrend was clear for Solana, and buyers appear hard to find as the price falls.
Looking ahead, SOL really needs the overall market sentiment to change and turn bullish. Otherwise, it is very hard to expect its price to recover from the recent losses. There is simply no demand at this time that can hold it from falling lower.

Tron (TRX)
Our list’s best performer, TRX, gained 10.2% this week on the strength of bullish fundamentals. In light of the current market, closing in the green on a weekly basis is quite an accomplishment. UST, which recently collapsed, is similar to the USDD stablecoin that keeps Tron going. To Mint USDD, burn TRX. TRX’s price has increased as a result of this positive feedback loop. Further, the Terra / Luna / UST ecosystem crash has left many investors looking for a new home, and Tron may be an option. According to the price action on the daily timeframe, TRX has formed a parabola.
TRX’s next key resistance level is $0.10. The last time it approached this level, sellers came in strongly, and they may again.

DOGECOIN (DOGE)
A 3.00% fall has been reported in the price of Dogecoin in the last 7 days. 6.26% has been added to the price in the last 24 hours. In just the past hour, the price grew by 0.65%. The current price is $0.08565 per DOGE. Dogecoin is 88.43% below the all-time high of $0.74.

TETHER (USDT)
This week has seen a rise in the price of Tether. In the past 7 days, Tether’s price has risen by 0.01%. In the last 24 hours, the price rose by 0.02%. A 0.01% increase has occurred in the price in just one hour. USDT is currently priced at $0.999105 per unit. There is an 18.11% drop from the all-time high of $1.22 for Tether.
The post <h5>Digital Asset Insights</h5> <h3>Digital Asset Insights #68</h3> appeared first on JP Fund Services.


