So, you want to get better at trading using MetaTrader 4? Good news, there are tools to help. One of those tools is the metatrader 4 spread indicator. It might sound a bit technical, but honestly, it’s pretty straightforward once you see how it works. This guide will walk you through what it is, how to use it, and some ways to make it work for your trading. Think of it as adding another lens to look at the market through. We’ll cover how to find it, put it on your charts, and what to do with the information it gives you. We’ll also touch on some more advanced stuff later on. Let’s get started.
Key Takeaways
- The metatrader 4 spread indicator shows the difference between buy and sell prices, which is a cost of trading.
- Understanding how spreads change can give clues about market volatility and liquidity.
- You can add and customize spread indicators directly within the MetaTrader 4 platform.
- Watching spread movements, especially around news events, can help traders make better decisions.
- Using spread analysis alongside other trading tools can lead to more informed entry and exit points.
Understanding the MetaTrader 4 Spread Indicator
What is a Spread Indicator?
In the world of trading, especially with platforms like MetaTrader 4 (MT4), you’ll often hear about ‘spreads’. Simply put, the spread is the difference between the buy price (ask) and the sell price (bid) for a particular currency pair or financial instrument. It’s essentially the cost of making a trade, paid to the broker. A spread indicator in MT4 isn’t a single, built-in tool you’ll find under the ‘Indicators’ menu like an RSI or Moving Average. Instead, it refers to how you visualize and analyze this bid-ask difference directly on your chart. Often, this involves displaying the ask price line alongside the bid price line, or using custom indicators designed to highlight spread fluctuations.
The Role of Spreads in Trading
Spreads are a pretty big deal for traders. They directly impact your profitability. When you open a trade, you’re immediately at a disadvantage equal to the spread. For example, if you buy EUR/USD at 1.1000 and the spread is 2 pips, your actual entry price is effectively 1.1002. To make a profit, the price needs to move in your favor by more than just the spread. High-frequency traders and scalpers, who make many small trades, are particularly sensitive to spread costs because these small differences can add up quickly. A tight spread means lower trading costs and a quicker path to profitability.
Here’s a quick look at how spreads affect different trading styles:
- Scalping: Requires very tight spreads as profits are made on small price movements. Wider spreads can make scalping impossible.
- Day Trading: Spreads are a significant cost, but generally manageable if the price moves sufficiently.
- Swing Trading: Spreads are less critical than for scalpers, but still contribute to overall costs.
- Long-Term Investing: Spreads have a minimal impact compared to the larger price swings over time.
Why Focus on Spreads in MT4?
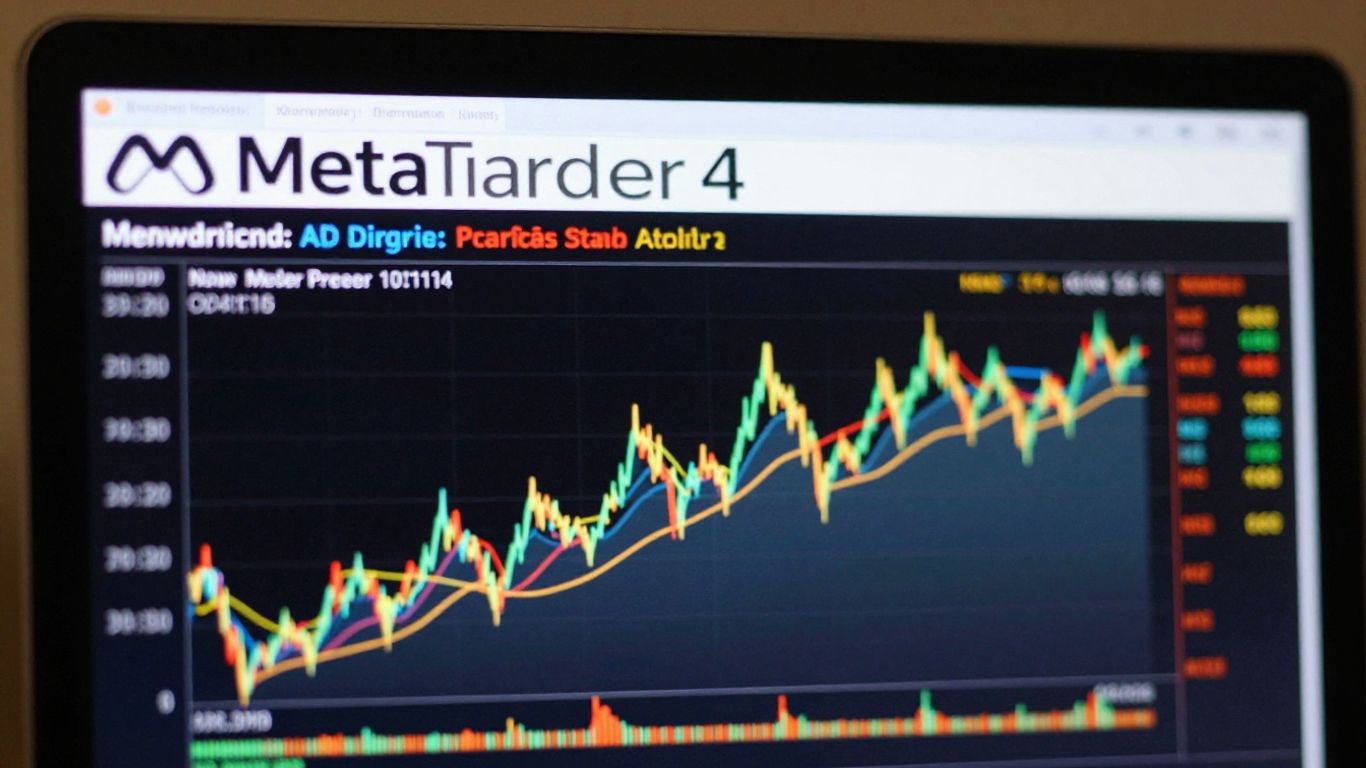
MetaTrader 4 is a popular platform, and understanding how spreads behave within it is key. MT4 allows for direct visualization of the bid and ask prices, which is the first step in spread analysis. You can often enable an ‘Ask Price Line’ in your chart settings. This simple addition lets you see the spread in real-time as a gap between two lines on your chart. Beyond just seeing it, analyzing spread behavior can give you clues about market conditions. For instance, spreads tend to widen during periods of low liquidity or high volatility, such as around major news events. Recognizing these patterns can help you avoid entering trades when costs are prohibitively high or when the market is too unpredictable.
Analyzing spreads isn’t just about knowing the cost of a trade; it’s about understanding market dynamics. When spreads are unusually wide, it often signals increased risk or uncertainty. Conversely, tight spreads can indicate stable market conditions and high liquidity, potentially offering better trading opportunities.
Integrating the MetaTrader 4 Spread Indicator
So, you’ve got your MetaTrader 4 platform open, and you’re ready to start looking at spreads. But how do you actually get these spread indicators onto your charts? It’s not as complicated as it might seem, and once you know the steps, you can start using them to get a better feel for the market.
Accessing Spread Indicators in MT4
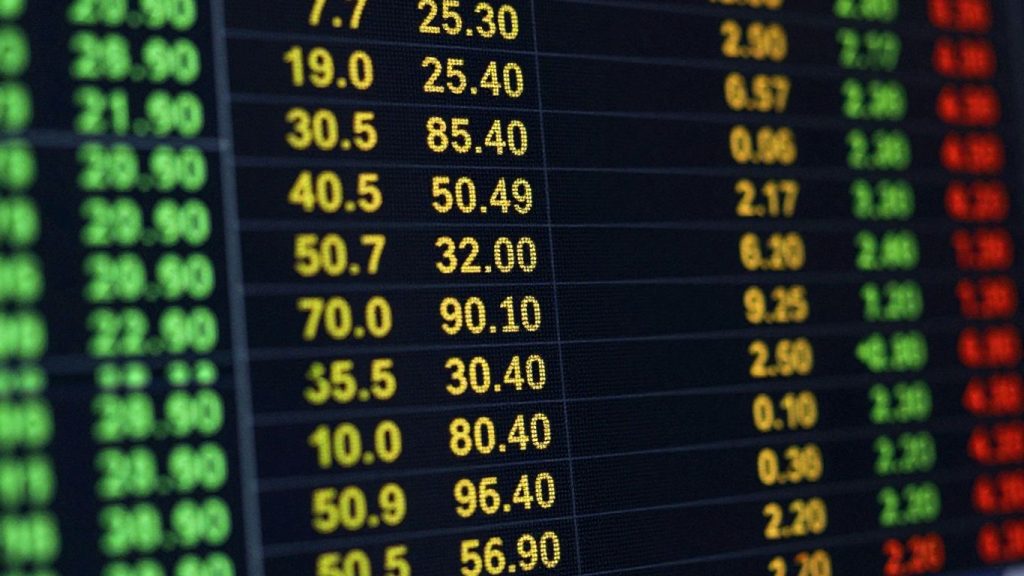
Most of the time, you won’t need to download anything extra to see spread information. MT4 usually has built-in ways to show you this. For a basic view, you can often just look at the ‘Market Watch’ window. This window, usually on the left side of your screen, lists all the currency pairs you’re watching. Right next to the price, you’ll see the current spread for each pair. It’s a simple list, but it gives you a quick snapshot.
If you want a more visual representation directly on your chart, you’ll likely be looking for custom indicators. While MT4 comes with a lot of standard indicators, specific spread indicators might be something you find from third-party developers. You can usually find these on trading forums or specialized websites. Once you download an indicator file (often with a .ex4 or .mq4 extension), you’ll need to place it in a specific folder within your MT4 installation directory. The common path is MetaTrader 4\MQL4\Indicators.
Applying Spread Indicators to Charts
Once you have an indicator ready, adding it to your chart is pretty straightforward. First, open the chart for the currency pair you want to analyze. Then, open the ‘Navigator’ window in MT4. If you don’t see it, go to the ‘View’ menu at the top and select ‘Navigator’. In the ‘Navigator’ window, you’ll see a list of ‘Indicators’. Expand this list. If you’ve added a custom indicator, it should appear here, possibly under a custom section or just in the main list. If you’re using a built-in spread display, it might be under a different category or accessible through chart properties.
To apply it, you can either double-click the indicator’s name or drag and drop it directly onto your chart. A settings window will pop up. This is where you can tweak how the indicator looks and behaves.
Customizing Spread Indicator Settings
This settings window is your playground. You’ll usually see a few tabs:
- Common: This tab often lets you choose which price data the indicator uses (like close price, open price, etc.) and whether to show it on a new window or the main chart.
- Inputs: This is where you’ll find the specific parameters for the indicator. For a spread indicator, this might include things like the period for calculating an average spread, or perhaps settings for how it visually represents widening or narrowing spreads.
- Colors: Pretty self-explanatory. You can change the colors of the lines or bars the indicator draws on your chart. Making spreads that are widening a different color from those that are narrowing can be really helpful.
- Levels: Some indicators allow you to set specific price levels or thresholds. For spreads, you might set a level that, if crossed, triggers an alert.
Don’t be afraid to experiment with these settings. What looks good and is useful for one trader might not be for another. Play around until you find a setup that makes the spread information clear and easy for you to understand at a glance.
Interpreting Spread Indicator Signals
Figuring out what the MetaTrader 4 spread indicator is showing you can make a real difference to how you trade, especially if you’re tired of getting tripped up by sudden cost changes. Let’s break down what to look for and how to act on those spread signals, without any confusing explanations.
Identifying Widening Spreads
When spreads get wider, it’s often a clue that something’s up with the market. A spike in spreads means there might be less liquidity or more volatility.
- Watch for spreads that jump suddenly, especially outside normal trading hours.
- Widening spreads happen a lot during major news releases or when markets are thin (like late Fridays or before holidays).
- Big spread increases can mean your costs just went up, so you might want to avoid entering new trades.
| Time of Day | Typical Spread | Widened Spread |
|---|---|---|
| London Open | 1.0 pip | 3.0 pips |
| After US Close | 1.2 pips | 4.0 pips |
| News Release | 1.1 pips | 5.0 pips |
If you notice growing spreads, maybe take a step back and wait for things to settle down. Forced trades in these conditions can end up costing a lot more than you expect.
Recognizing Narrowing Spreads
Narrower spreads generally mean more liquidity and steadier market conditions.
- Spreads usually shrink when big financial centers are active (like when London and New York are both open).
- Tight spreads are ideal for scalpers or anyone who trades often.
- When spreads narrow after widening, it can signal the end of a volatile news move or the return of normal market activity.
- Good times for narrow spreads:
Spread Behavior During News Events
Major news can send spreads spinning in seconds. It’s kind of like watching prices on fast-forward.
- Typical news events that move spreads: central bank decisions, jobs reports, or surprise headlines.
- Spreads can yank higher before, during, and right after the news drops.
- Sometimes it’s best to wait a few minutes after big announcements before trading, just to let spreads get back to normal.
| News Event | Pre-News Spread | Event Spread | Post-News Spread |
|---|---|---|---|
| Non-farm Payrolls | 1.2 pips | 6.0 pips | 1.5 pips |
| FOMC Statement | 1.0 pip | 5.5 pips | 1.3 pips |
Monitoring these spread changes during news can save you from unexpected costs or a frustrating stop-out. Sometimes, sitting on your hands for a few minutes really is the smartest move.
Advanced Strategies with the MetaTrader 4 Spread Indicator
Combining Spread Indicators with Other Tools
Pairing the MT4 spread indicator with other trading tools helps you spot more reliable opportunities. For example, if you’re using RSI or moving averages, you can:
- Overlay the spread indicator on your preferred price chart.
- Run both a trend indicator (like the EMA) and the spread indicator together to filter out weak signals.
- Set alerts for when both the spread and another indicator meet certain criteria at the same time (e.g., spread widens AND RSI hits overbought).
| Tool | Purpose | When to Use It |
|---|---|---|
| Spread Indicator | Monitors cost of trading | Always, for every new trade |
| RSI | Measures momentum | Confirm if price is overbought/oversold |
| EMA | Tracks trend direction | Checks if trend backs your setup |
When you combine tools, you cut down on random trades and increase your confidence with each position you take.
Using Spread Data for Trade Entry and Exit
Choosing when to get in and out of a trade just gets more logical with spread data. Here’s how most traders do it:
- Watch for narrowing spreads—spreads often get tight when markets are calm or liquid. That’s generally a better time to enter a position.
- Be careful of rapid spread widening—it’s a warning of poor liquidity or upcoming volatility, so consider delaying entry or adjusting your exit.
- For short-term scalping, only enter trades when the spread sits below your average threshold for that pair (e.g., less than 2 pips for EUR/USD).
Leveraging Spread Analysis for Risk Management
Spread behavior isn’t just about saving on entry costs—it also gives you clues about risk:
- A sudden spike in spread means something unusual is happening. You might want to reduce position size or skip the trade altogether.
- Ongoing wide spreads drain profits and can turn a decent trade into a losing one if you’re not careful.
- Use the spread data to tweak your stop loss or take profit, allowing some room for normal spread fluctuations.
Staying aware of spread changes means you’re less likely to get stopped out by random price jumps due to illiquidity or broker markups—not just market moves.
Optimizing Your Trading with Spread Insights
So, you’ve got a handle on what spreads are and how to spot them on your MetaTrader 4 charts. That’s great! But just knowing about them isn’t enough, right? We need to actually use this knowledge to make our trading better. Think of it like having a fancy toolbox – you need to know how to use the tools to build something solid.
Backtesting Strategies Using Spread Data
Before you risk real money, you gotta test your ideas. Backtesting is basically replaying history to see how your strategy would have performed. When you’re looking at spreads, this means checking if your entry or exit rules, which might be based on spread widening or narrowing, would have actually worked out.
Here’s a simple way to think about it:
- Define your spread-based rule: For example, "Only enter a buy trade if the spread on EUR/USD narrows by more than 2 pips in the last 10 minutes and the RSI is below 30."
- Set your parameters: Decide on the currency pair, timeframe, and the specific spread conditions you’re looking for.
- Run the Strategy Tester: Load historical data into MT4’s Strategy Tester and apply your rule.
- Analyze the results: Look at the profit factor, win rate, and drawdown. Did your spread rule help or hurt?
It’s not just about finding winning trades; it’s about seeing if your spread analysis helps avoid bad ones too. You might find that certain spread behaviors are actually red flags for upcoming reversals.
Developing a Trading Plan Around Spreads
Your trading plan is your roadmap. If spreads are a big part of your strategy, they need to be clearly written down. This isn’t just about setting stop-losses, though that’s super important too. It’s about defining when you trade and when you don’t, based on spread conditions.
Consider these points for your plan:
- Ideal Spread Conditions: What spread size do you consider normal for your chosen pairs and timeframes? When do you feel most comfortable trading?
- Warning Signs: What spread behavior makes you pause? Maybe a sudden widening before a major news release, or consistently high spreads on a specific pair.
- Trade Entry/Exit Triggers: How do specific spread movements (like a sharp contraction or expansion) influence your decision to enter or exit a trade, perhaps in conjunction with other indicators?
- Risk Management: How do spreads affect your position sizing? Wider spreads might mean smaller positions to keep your risk per trade consistent.
A well-defined trading plan acts as a filter, helping you stick to your strategy even when emotions run high. It prevents impulsive decisions and keeps your focus on the setups that align with your tested approach, especially when spread dynamics are a key component.
Adapting to Changing Market Spread Conditions
Markets aren’t static, and neither are spreads. What worked last year might not work today. Spreads can change due to economic events, changes in market volatility, or even broker policy updates. Staying sharp means keeping an eye on these shifts.
- Monitor Volatility: High volatility often means wider spreads. If you’re used to tight spreads, you’ll need to adjust your expectations and potentially your strategy during these periods.
- News Event Awareness: As we’ve discussed, spreads can blow out around major news. Your plan should dictate how you handle this – do you avoid trading, or do you have a specific strategy for trading volatility?
- Broker Comparison: Sometimes, differences in spreads between brokers can be significant. While you shouldn’t jump brokers constantly, be aware if your current broker’s spreads are becoming uncompetitive for your strategy.
Regularly reviewing your backtesting results and your trading journal will help you spot these changes. If you notice your strategy’s performance dipping, investigate if spread conditions have changed and if your plan needs a tweak. It’s all about continuous improvement, making sure your MT4 setup works for you, not against you.
Wrapping It Up
So, we’ve gone over how to use the spread indicator in MetaTrader 4. It’s not some magic bullet, but when you use it right, alongside other tools and a solid plan, it can really help you see the market a bit clearer. Remember to keep practicing, maybe try out different settings, and most importantly, don’t forget about managing your risk. Trading is a journey, and understanding tools like the spread indicator is just one part of getting better at it. Keep learning, stay disciplined, and you’ll be on your way.
Frequently Asked Questions
What exactly is a spread in trading, and why is it important?
Think of a spread as the tiny difference between the price you can buy something for and the price you can sell it for, right at that moment. It’s like the seller’s fee. This difference matters because it’s one of the costs you pay to trade. If the spread is wide, it means you need the price to move more just to break even on your trade.
How can I see the spread on my MetaTrader 4 charts?
MetaTrader 4 usually shows you the spread automatically. You can often see it right next to the current price on your chart, or in the ‘Market Watch’ window where you see all the currency pairs. If you don’t see it, you might need to check the indicator settings or your broker’s specific setup.
Does the spread change during the day?
Yes, definitely! Spreads are like the weather – they change all the time. They tend to get smaller when the market is calm and lots of people are trading. But when big news comes out or the market gets wild, spreads can get much wider because it’s riskier for the people offering prices.
Can I use spread information to help me trade better?
Absolutely! Watching the spread can give you clues. If the spread suddenly gets very wide, it might mean something important is happening, or it could be a bad time to enter a trade. If spreads are consistently narrow, it might suggest a stable market. Some traders even use spread patterns as part of their strategy.
Are there special ‘spread indicators’ I can add to MT4?
While MT4 shows the spread itself, there aren’t usually separate ‘spread indicators’ that you add like RSI or Moving Averages. The spread is more of a direct market condition. However, you can use other indicators to see how the market *behaves* when spreads are wide or narrow, which helps you understand the context.
What’s the difference between a ‘fixed spread’ and a ‘variable spread’?
A fixed spread stays the same, no matter what’s happening in the market. A variable spread, which is more common, changes. It gets smaller when trading is easy and wider when the market is unpredictable or during big news events. Most traders deal with variable spreads, so understanding how they change is key.


