
Getting into day trading means you’ll need good tools to see what the market is doing. Having the right day trading chart software can really make a difference. It helps you spot trends and make quicker decisions. This article looks at some of the best day trading chart software options out there for 2025, covering everything from user-friendly choices to more advanced platforms, and even some free ones. We’ll also touch on how to use these tools with your trading plans.
Key Takeaways
- Choosing the right day trading chart software is important for making smart trading decisions.
- Platforms like Benzinga Pro, TradingView, and ChartPrime offer different features for various trading needs.
- Specialized software like Thinkorswim, MetaTrader, and NinjaTrader cater to specific markets like Forex and futures.
- Free day trading chart software options such as ProRealTime Web, Yahoo Finance, and Koyfin can be good starting points.
- Using charting tools effectively, like with volume analysis and stop-loss orders, can improve your trading strategy.
Understanding Essential Day Trading Chart Software
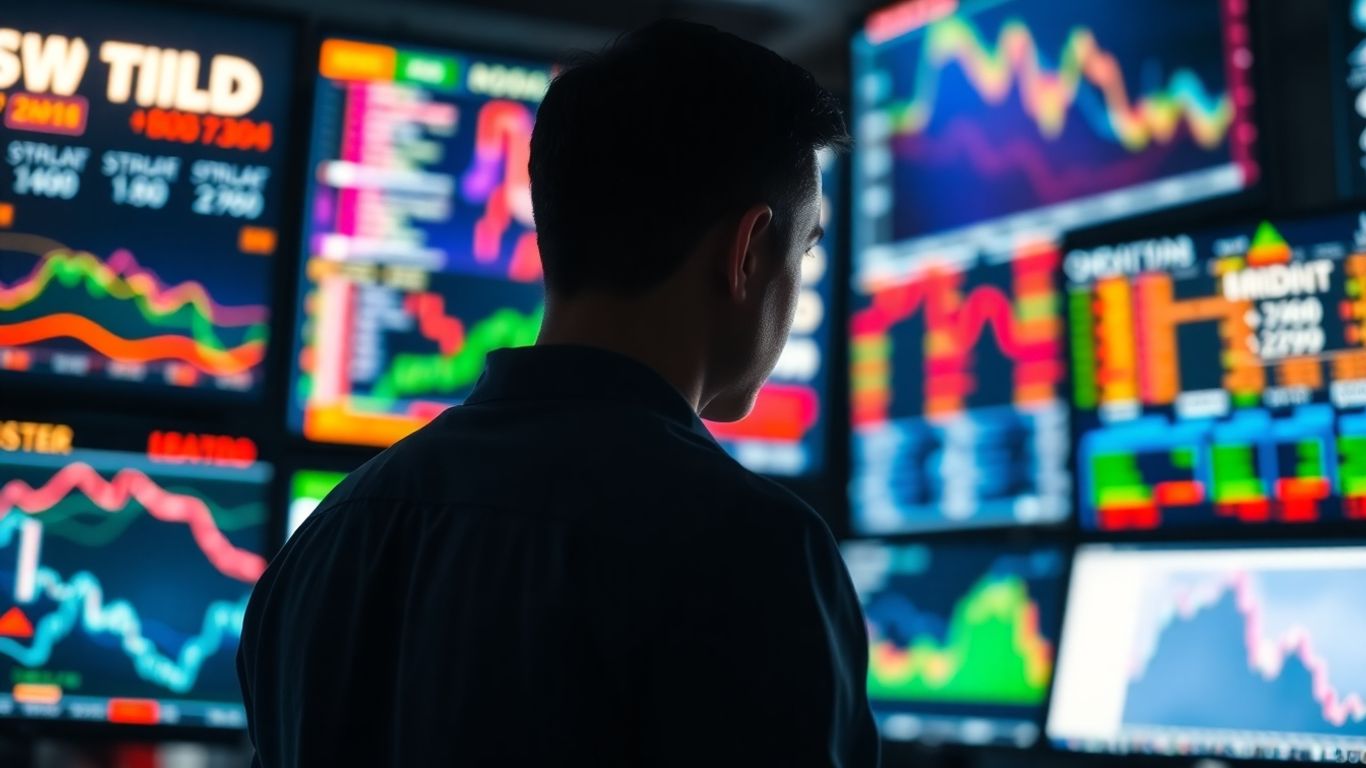
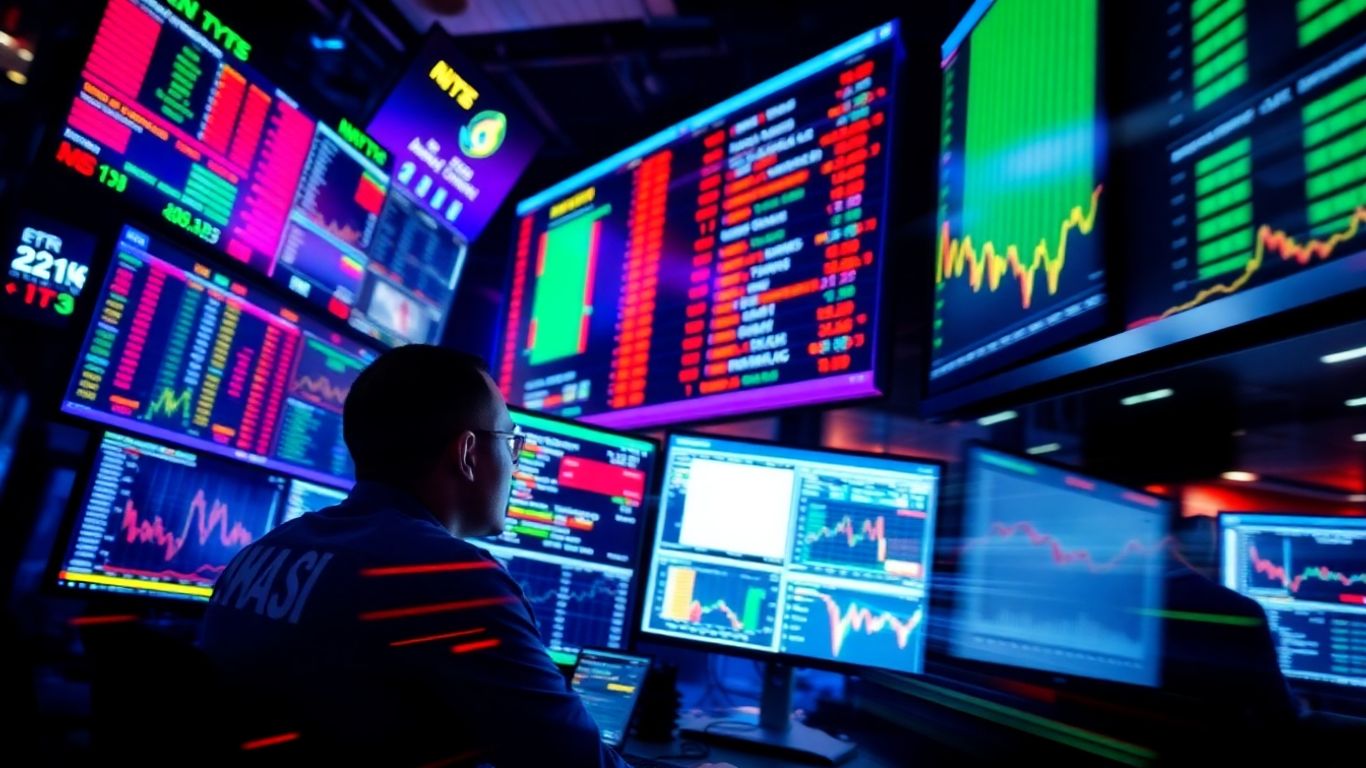
Day trading is all about making quick decisions based on what the market is doing right now. You’re not holding positions overnight, so you need to see price changes as they happen. That’s where charting software comes in. These platforms are your eyes and ears in the market, showing you price action, volume, and a bunch of other data that helps you figure out what to do next. Without good charts, you’re basically trading blind. It’s like trying to drive without a dashboard – you don’t know your speed, your fuel level, or if something’s about to go wrong.
Defining Day Trading Chart Software
So, what exactly is day trading chart software? Simply put, it’s a program or online service that displays financial market data, like stock prices, in a visual format. Think of it as a dynamic map of the market. Instead of just seeing numbers, you see lines, bars, and shapes that represent price movements over time. This visual representation makes it much easier to spot trends, patterns, and potential trading opportunities. These tools are built for speed and accuracy, giving you the information you need in real-time so you can react quickly to market shifts. They are the backbone of technical analysis for anyone trying to profit from short-term price swings.
Key Features for Day Traders
When you’re day trading, you can’t afford to mess around with clunky software. You need tools that are fast, reliable, and give you the information you need without a fuss. Here are some things to look for:
- Real-time Data: This is non-negotiable. You need to see prices updating instantly. Delays can cost you money.
- Speed and Performance: The software needs to load quickly and handle lots of data without freezing up. You don’t want your platform crashing when a big move happens.
- Customization: Being able to tweak charts, add indicators, and set up alerts just the way you like them is super important. Everyone trades differently, so your software should adapt to you.
- Alerts: Setting up notifications for specific price levels or indicator signals can save you from constantly staring at the screen.
- Drawing Tools: Being able to draw trendlines, support/resistance levels, and other annotations directly on the chart helps you visualize your analysis.
The Role of Charting in Market Analysis
Charting software is where the magic of technical analysis happens. It’s not just about pretty pictures; it’s about using historical price and volume data to predict future movements. Traders look at chart patterns, like head and shoulders or double tops, to guess where the price might go next. They also use technical indicators, such as moving averages or the Relative Strength Index (RSI), which are mathematical calculations based on price and volume. These indicators can help confirm trends, identify overbought or oversold conditions, and signal potential entry or exit points. Essentially, charts help traders translate raw market data into actionable trading ideas. They provide a framework for understanding market psychology and making informed decisions, rather than just guessing. For example, seeing a sudden spike in volume alongside a price increase might suggest strong buying interest, which could be a signal to enter a long trade. You can explore platforms like TradingView to see how these features work in practice.
Day trading is a fast-paced game. You’re trying to catch small price movements, and you need tools that can keep up. The right charting software gives you the clarity and speed to make those split-second decisions. It’s about seeing the story the market is telling you through its price action and volume, and then acting on that story before it changes.
Top Day Trading Chart Software Platforms
Choosing the right charting software is a big deal for day traders. It’s not just about pretty pictures; it’s about having the right tools to see what the market might do next. We’ve looked at a bunch of options, and a few really stand out for their features and how easy they are to use. These platforms are built to help you make quicker, smarter decisions when every second counts.
Benzinga Pro: A User-Friendly Choice
Benzinga Pro is a solid pick, especially if you’re just getting into day trading or prefer a platform that doesn’t feel overwhelming. It’s known for being pretty straightforward to use while still giving you the charting capabilities you need. You get real-time charts that you can tweak to your liking – change the timeframes, add indicators, or draw lines to mark important price levels. They offer different chart styles like candlesticks, bars, and lines, so you can pick what works best for your eyes and your strategy. It’s a great starting point for traders of all levels.
TradingView: Comprehensive Charts and Community
TradingView is a powerhouse when it comes to charts. It’s an online platform packed with tools for technical analysis. You can get real-time and historical data for pretty much anything – stocks, forex, crypto, you name it. The charting itself is super flexible. You can load up on indicators, use drawing tools, and really dig into the price action. What’s cool is the community aspect; you can share your charts and ideas with other traders, which can be super helpful. It’s a robust solution for day traders looking for advanced charting capabilities and collaboration within the trading community.
ChartPrime: Advanced Tools for Informed Decisions
ChartPrime is more about a suite of advanced tools designed to help you analyze markets and make better investment choices. It’s built for traders who want to get a deeper look at trends and use specific indicators. You can connect it with your TradingView account to get alerts and data. It’s designed to help traders, whether they’re into stocks, forex, or crypto, by providing indicators and automatic updates. This platform aims to give you the information you need without relying on others for every bit of news or analysis. It’s a good option if you’re looking for something a bit more specialized to guide your trades.
When you’re day trading, speed and accuracy are key. The software you choose directly impacts your ability to react to market changes. Look for platforms that offer fast data feeds and tools that let you quickly analyze price movements and patterns. Don’t underestimate the value of a clean interface that reduces distractions and helps you focus on the charts.
Here’s a quick look at some of the platforms mentioned:
| Platform | Best For |
|---|---|
| Benzinga Pro | All Trading Levels |
| TradingView | Comprehensive Charts |
| ChartPrime | Advanced Trading Tools |
Remember, the best platform for you depends on your personal trading style and what you need to see. It’s worth exploring leading day trading chart platforms to see which one feels right.
Specialized Day Trading Chart Software
While many platforms offer general charting capabilities, some are built with specific trading styles or markets in mind. If you’re focusing on particular instruments or require advanced features, these specialized tools might be exactly what you need.
Thinkorswim for Forex and Investing
Thinkorswim, a platform often associated with Charles Schwab, is a popular choice, especially for those interested in forex trading and longer-term investing. It provides a solid charting package that includes real-time data and a good selection of technical indicators. The platform is known for its user-friendly interface, making it accessible even for those who aren’t deeply technical. You can customize charts with various drawing tools and studies, and it also offers paper trading, which is great for practicing without risking real money.
- Real-time forex data: Access up-to-the-minute price movements for major currency pairs.
- Advanced charting tools: Includes a variety of indicators and drawing options.
- Paper trading: Practice your strategies in a simulated environment.
- Investment analysis features: Beyond day trading, it supports broader investment research.
MetaTrader: Powerhouse for Technical Analysis
MetaTrader, particularly versions MT4 and MT5, is a titan in the world of technical analysis, especially within the forex market. It’s packed with an enormous library of technical indicators, both built-in and custom. If you’re into deep dives with indicators, moving averages, oscillators, and complex chart patterns, MetaTrader is a strong contender. It also supports automated trading through Expert Advisors (EAs), allowing you to program trading strategies. The charting is highly customizable, letting you tweak everything from timeframes to color schemes.
The sheer volume of technical indicators and the ability to code custom ones make MetaTrader a go-to for traders who live and breathe technical analysis. It’s not just about looking at charts; it’s about dissecting them with every tool imaginable.
NinjaTrader for Advanced Futures Trading
NinjaTrader has carved out a niche for itself, particularly among futures traders. It offers a robust charting interface designed for high-performance trading. You get access to real-time and historical data for futures, stocks, and forex. What sets NinjaTrader apart for some is its advanced charting features, market replay functionality (allowing you to practice on past market data), and backtesting capabilities. It’s a platform that serious futures day traders often gravitate towards for its depth and control.
- Futures market focus: Tailored tools and data for futures traders.
- Market Replay: Practice trading on historical data to hone your skills.
- Backtesting: Test your strategies against past market performance.
- Order flow analysis: Tools to help understand buying and selling pressure.
Evaluating Charting Software Features
When you’re looking at day trading chart software, it’s not just about pretty pictures. You need tools that actually help you see what’s going on and make smart moves. Think about what you’ll be doing most often. Are you someone who likes to draw on charts a lot, or do you prefer to load up a bunch of indicators and see what they say? The software needs to match your style.
Chart Types and Customization Options
Most charting platforms will give you the basics: line charts, bar charts, and candlestick charts. Candlestick charts are usually the go-to for day traders because they show the open, high, low, and close price for a period, giving you a lot of info at a glance. But beyond that, how much can you tweak things? Can you change the colors, the timeframes, or how the data is displayed? Some platforms let you get really granular with this, while others are more locked down. Being able to set up your charts exactly how you like them can make a big difference in how quickly you can spot opportunities. For example, some traders like to see multiple charts on one screen, maybe a daily chart next to a 5-minute chart. Check if the software makes this easy or if it’s a struggle.
Technical Indicators and Drawing Tools
This is where the real analysis happens. Technical indicators are mathematical calculations based on price and volume that can help predict future price movements. Things like Moving Averages, MACD, and RSI are pretty standard. You’ll want to see if the software has the indicators you use, or if it’s easy to add new ones. Also, consider how many indicators you can put on a single chart. Some free versions limit you to just a few, which can be frustrating if you like to layer your analysis. Drawing tools are also key. These let you draw trendlines, support and resistance levels, Fibonacci retracements, and more directly on the chart. The best platforms make these tools intuitive and easy to use. You don’t want to spend ages trying to draw a simple trendline.
Real-Time Data and Historical Access
For day trading, real-time data is non-negotiable. You need to see price movements as they happen, not with a delay. Make sure the software provides live data feeds for the markets you trade. Beyond that, think about historical data. How far back can you go? Do you need years of data to backtest strategies, or is a few months enough? Some platforms offer extensive historical data, while others might charge extra or limit what you can access. It’s also worth checking the quality of the data. Is it clean and accurate? Bad data can lead to bad analysis, no matter how good the software is. If you’re looking for a platform that offers a good balance of features for technical analysis, you might want to check out stock charting software.
The ability to save your chart layouts and settings is a feature that often gets overlooked, but it’s a real time-saver. Constantly having to set up your preferred indicators and drawing tools every time you open the software can be a pain. Look for platforms that let you save your workspaces so you can quickly jump back into your analysis without starting from scratch.
Leveraging Free Day Trading Chart Software
You don’t always need to shell out cash to get good charting tools for day trading. Seriously, there are some solid options out there that give you a lot of bang for your buck – which is zero bucks. It’s pretty cool that you can get access to market data and analysis features without hitting a paywall. This means you can practice and refine your strategies without any financial commitment, which is a big deal when you’re just starting out or testing new approaches.
ProRealTime Web: A Feature-Rich Free Option
ProRealTime Web is a standout when it comes to free charting. It offers a really clean interface and a good set of tools that many paid platforms charge for. You get access to a decent range of technical indicators and drawing tools, which is great for marking up charts and spotting potential trends. The platform is also pretty customizable, so you can tweak it to fit how you like to see your data. It’s a strong contender if you want a serious charting experience without the cost.
Yahoo Finance and StockCharts for Basic Needs
If you’re looking for something a bit simpler, Yahoo Finance and StockCharts.com are good places to start. Yahoo Finance is super accessible and gives you real-time stock quotes along with basic charting capabilities. It’s not as fancy as some other platforms, but it gets the job done for quick checks and basic analysis. StockCharts.com also has a free version that provides charting tools and indicators, though it does limit you to a few indicators per chart and doesn’t offer the most extensive historical data. Still, for everyday market watching, they’re perfectly fine.
Koyfin for Data Visualization
Koyfin is another interesting free option, especially if you’re into visualizing financial data. It goes beyond just basic stock charts and offers tools to look at economic data, company financials, and market trends in a more visual way. While its charting tools might be a bit more basic compared to dedicated charting platforms, its strength lies in presenting a wider range of financial information clearly. It’s a good choice if you want to see the bigger economic picture alongside your stock analysis. You can find more about different trading platforms at Interactive Brokers.
When you’re starting with free charting software, it’s easy to get overwhelmed by all the options. The key is to try a few out and see which one feels right for your trading style. Don’t be afraid to experiment. What works for one trader might not work for another, and that’s totally okay. Focus on the tools that help you see the market clearly and make decisions confidently.
Here’s a quick look at what some of these free tools offer:
- ProRealTime Web: Good for detailed charting, lots of indicators, and customization.
- Yahoo Finance: Easy to use for quick checks, real-time quotes, and basic charts.
- StockCharts.com: Reliable for standard charting, but with some limitations on indicators.
- Koyfin: Excellent for visualizing financial and economic data alongside market trends.
Using these free resources can really help you get a feel for technical analysis and market movements without any upfront cost. It’s a smart way to build your trading knowledge and skills.
Integrating Chart Software with Trading Strategies
Using charting software effectively means more than just looking at pretty pictures. It’s about making those charts work for you, helping you spot opportunities and manage risk. Think of your charting platform as your co-pilot in the trading world. It gives you the data, but you need to know how to interpret it and act on it.
Volume Analysis for Confirming Breakouts
Volume is a big deal when you’re looking at price movements. A breakout in price, where it moves decisively above resistance or below support, is way more convincing if it’s backed by high trading volume. Low volume on a breakout? That’s often a sign it might fail. Your charting software will show you volume bars, usually at the bottom of the price chart. Look for spikes in volume that coincide with the price breaking through a key level. This helps confirm that there’s real interest from traders pushing the price in that direction. It’s a simple but powerful way to filter out false signals.
Utilizing Stop-Loss Orders with Chart Patterns
Chart patterns are like recurring shapes that can give clues about where a price might go next. Think of things like head and shoulders, triangles, or flags. When you identify a pattern and decide to enter a trade based on it, you absolutely need to set a stop-loss order. This is your safety net. Your charting software lets you visually place these orders based on the pattern’s structure. For example, if you’re trading a bullish flag pattern, you might place your stop-loss just below the low of the flag’s pole. This limits your potential loss if the pattern doesn’t play out as expected. It’s about protecting your capital so you can stay in the game.
Multi-Timeframe Analysis for Better Decisions
Looking at charts on just one timeframe can be misleading. A stock might look like it’s trending up on a 5-minute chart, but if you zoom out to a daily chart, you might see it’s actually in a strong downtrend. Multi-timeframe analysis means checking your charts on different time scales – like minutes, hours, and days. Your charting software makes this easy. You can open multiple charts of the same asset, each on a different timeframe. This gives you a more complete picture. You can spot short-term opportunities while making sure they align with the bigger trend. This approach helps you make more informed decisions and avoid getting caught on the wrong side of a major move. Many traders find platforms like TradingView particularly useful for this kind of analysis due to their flexible charting layouts.
The real power of charting software comes when you combine its visual data with a disciplined trading plan. Without a plan, even the most advanced charts are just noise. Stick to your strategy, use the tools to confirm your ideas, and always manage your risk.
Wrapping It Up: Your Charting Toolkit for 2025
So, we’ve looked at a bunch of charting software that can help you out in the day trading world for 2025. Whether you’re just starting and need something simple like Benzinga, or you’re looking for all the bells and whistles with TradingView or ChartPrime, there’s definitely an option out there for you. Remember, the best tool is the one you actually use and understand. Don’t be afraid to try a few out, maybe even the free versions first, to see what feels right. Getting comfortable with your charting software is a big step towards making better trading decisions. Good luck out there!
Frequently Asked Questions
What’s the best chart to use for day trading?
The ‘best’ chart really depends on what you like and what you’re trying to do. Many traders like candlestick charts because they show a lot of information like the high, low, open, and close prices for a certain time. But really, the best one is the chart you understand best and that helps you see what the market is doing.
Do I need special software to day trade?
Yes, you’ll need good charting software. Day trading happens fast, so you need tools that show you real-time prices and let you analyze trends quickly. Think of it like a race car driver needing a good dashboard to see their speed and controls.
What are the most important features in day trading software?
Look for software that gives you real-time price updates, lots of different chart types, tools to draw on charts (like trend lines), and technical indicators (like moving averages). Being able to customize your charts is also super helpful so you can set it up just how you like it.
Can I day trade without paying for software?
You can start with free charting tools! Sites like Yahoo Finance or TradingView offer free versions that are pretty good for learning. Some brokers also give you charting tools if you have an account with them. As you get more serious, you might want to pay for more advanced features.
How do charts help me make money day trading?
Charts help you see patterns in how prices move. By studying these patterns and using tools like indicators, you can try to guess where the price might go next. It’s like looking at a weather map to predict if it will rain. It’s not perfect, but it helps you make smarter guesses.
What’s the difference between free and paid charting software?
Free software usually gives you the basics, like standard charts and a few tools. Paid software often gives you more advanced features, like faster data, more indicators, better drawing tools, the ability to save more setups, and sometimes even alerts. It’s like the difference between a basic calculator and a scientific one.


