It’s often written in the small print of anything forex-related that “Past performance is no guarantee of future results.”
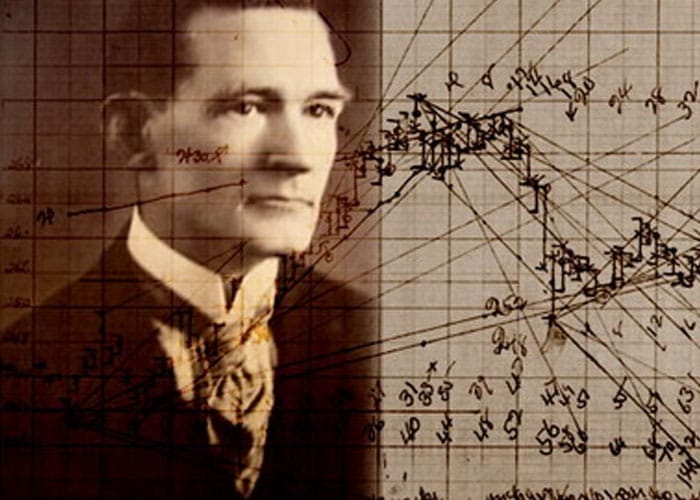
But while this is no doubt empirically true – in that it provides no ‘guarantee’ – past performance is in fact the best indicator we have of how the market is likely to behave in future. One trader who subscribed to this school of thought was Wilbert Gann, who was born in rural Texas in 1878.
Gann started his trading career at the age of 24, but he was initially rather unsuccessful, incurring a string of damaging losses. Not to be deterred, he believed that his lack of trading success was down to a lack of knowledge, and hit the library to study historical stock transactions dating back as far as 1820. For nine months, he pored over stock movements and related statistics to see if he could identify any repeating patterns or stand-out characteristics.
What he concluded from this period of intensive study is that movements in the values of stocks were governed by scientific laws, and could therefore be predicted if sufficient information was available. For the next decade or so Gann refined his theories, looking specifically at just three historical factors s to judge future price movements, namely price, time periods, and patterns. According to his reasoning, the cyclical movements of stock prices were similar to the vibrations of a plucked wire – such as a guitar string – and were therefore governed by similar scientific laws.
The results of these studies were what were to become known as Gann Angles, which are geometrical overlays on stock charts that can be used to work out the derivative of a price from looking at the tops and bottoms of a price pattern. These overlays can be applied to daily, weekly, or monthly price charts.
Here’s how it works. When a price is trending upwards and the price stays within the space above an ascending angle without tripping below it, the market is strong, and if this phenomenon can also be observed in the mirror image, then the market is weak. This technical tool can then be used to set entry and exit points for a trade.
Although it can take a lot of practice to analyse a forex market with Gann angles, the basics are straightforward enough. First, you need to select a time frame for historical results, and this is usually determined by the distances in which significant price movements take place.
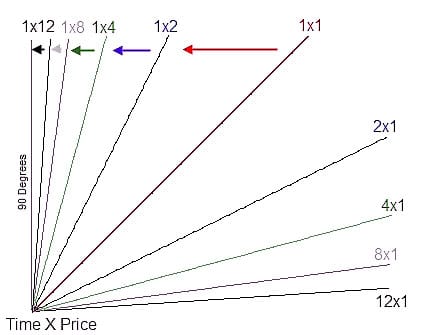
Then, you need to use your judgement to estimate the high and low points used to draw the Gann lines. From this, there are nine possible Gann angles that can result, the purest being a 45-degree angle, giving you a 1:1 ratio between time and price. If the ratio is higher than that, then the market is bullish; lower, and you are looking at a bear market. This can be very useful for traders who aim to match their trades to the trend in the market.
Gann’s tireless work developing his revolutionary technical analysis techniques paid off, and it is claimed that he used his angle technique to earn a fortune of $50 million in the markets. One of his most famous trades was the purchase of New York Central Railroad shares when they were trading at 131. Using his technique, Gann correctly predicted that the stock price would swing upwards to 144 before falling to 129, and raked in a handsome profit as a result.
From a forex trading perspective, Gann angles can be a highly useful tool for increasing the accuracy of your analyses and trades. While it provides no guarantee of success in today’s markets, you still find that learning patterns of volatility, price scales and market movements can improve your analysis skills in a meaningful fashion, leading to more profitable trades in the future.
Read More:
what are ict concepts in trading?
Tradersdna is a leading digital and social media platform for traders and investors. Tradersdna offers premiere resources for trading and investing education, digital resources for personal finance, market analysis and free trading guides. More about TradersDNA Features: What Does It Take to Become an Aggressive Trader? | Everything You Need to Know About White Label Trading Software | Advantages of Automated Forex Trading