In the first part of our series on trading Inside Bar patterns, we shall explain how to identify these candlestick formations, both in isolation and in the context of the wider moves that they can help to identify.
The idea behind this strategy is to spot consolidation patterns at key support and resistance levels in daily candlestick charts, which often precede a breakout. This is one of the simplest strategies to grasp the basics of, but it can also be one of the most effective – particularly if you are disciplined and careful in your application of it.
It should be emphasised before we begin that this strategy is intended for use with daily charts, and in every example, a single bar represents a day of trading.
What is an Inside Bar?
Inside Bars are candlestick patterns that form when an entire bar’s price action range (eg Open, Low, High and Close) takes place within the high and low of the previous bar. This means that the highest price on the inside bar is lower than the highest price on the previous day, and the lowest price is higher than the previous day’s low.
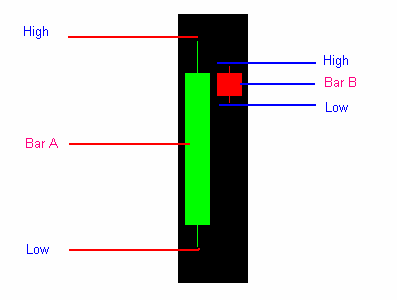
Bar B: The ‘Inside Bar’
When do Inside Bars Occur?
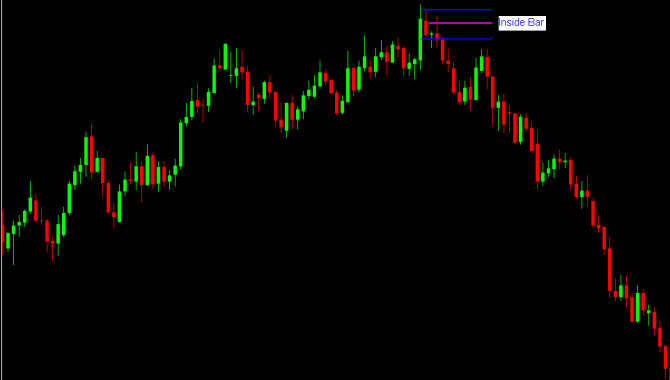
Reversals: When the price action hits a point of strong resistance, the major market participants tend to start locking in their profits by closing their open positions, with bears building short positions and buyers covering their long positions. This exchange takes place within a relatively small price area, often resulting in the formation of an inside bar.
In the chart below, we can see that after a long upwards move, the price is re-tested at a strong resistance level, forming an inside bar. The downside of this breakout then leads to a steep reversal.
Source: ForexCrunch
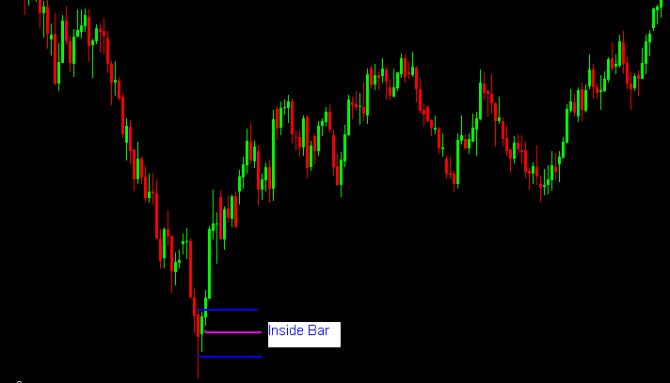
The converse can happen when the price action hits a strong support area, which can lead to the bulls building long positions and the bears start covering their short positions. This can lead to the formation of an inside bar, followed by a strong upside reversal, as in the chart below:
Source: ForexCrunch
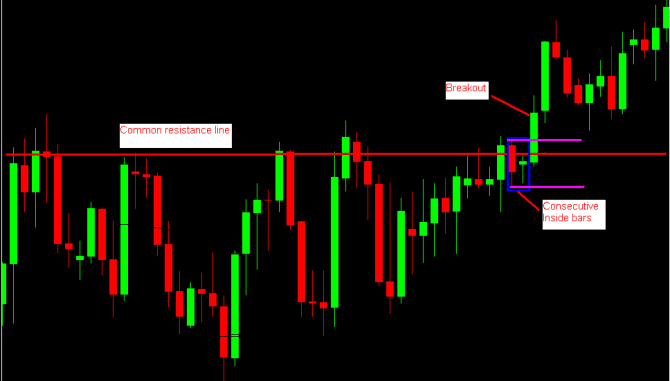
Breakouts: Key resistance and support levels are only broken when there are a lot of traders willing to bid above resistance or below support levels. Therefore, before a strong breakout, there is often a period of consolidation where the buyers and sellers build their positions for a potential breakout. It is common to have inside bars in these areas of consolidation before a strong breakout from key support or resistance levels.
In the chart below, multiple inside bars represent the process of accumulation before the price breaks through the key resistance area:
Source: ForexCrunch
Consolidation: After the price has made a strong move in a single direction, it tends to halt and enter a process of consolidation before continuing to move in the same direction. This consolidation occurs because:
- Traders who are sitting on profitable trades want to cover their positions by locking in profits, or add to their profitable positions
- Traders who are sitting on losing trades want to cover their losses by closing positions and taking opposing ones.
- Traders who missed the initial move now want to open new positions
When there are so many parties involved in an exchange of hands at a key price level, it tends to lead to a big consolidation, represented by an inside bar. Often, inside bars occur after a strong initial price rally or decline, and these types of inside bars can be considered indicators of consolidation.
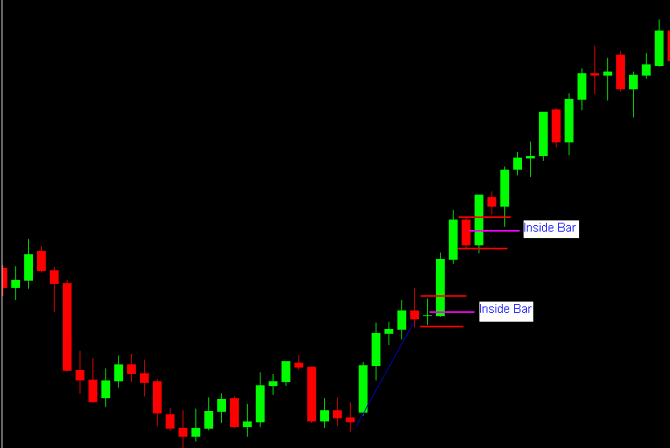
Source: ForexCrunch
Ranging markets: When the major market participants lose interest in the market, liquidity decreases dramatically and the price ceases to make any major moves, leading the market to trade within a narrow range. This can be called a ‘period of indecision’, as neither big buyers or big sellers are willing to enter the market. Inside bars tend to be very prevalent during this period, as you can see from the chart below, and traders should exercise caution when presented with inside bars of this type.
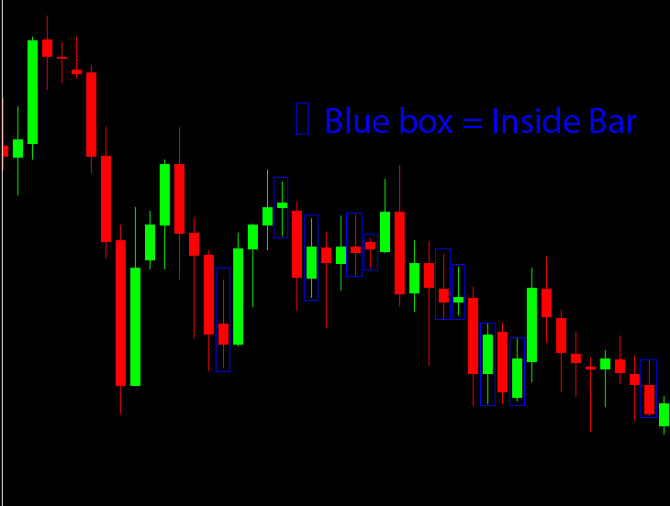
The length of this period depends on various factors, but it usually continues until a market-moving event (such as the US Nonfarm Payroll release) prompts institutional traders back into the market.
In the next instalment of our guide to trading Inside Bar Breakouts, we shall be looking at the various ways in which you can find reliable inside bars, and look at strategies for trading these formations.
Tradersdna is a leading digital and social media platform for traders and investors. Tradersdna offers premiere resources for trading and investing education, digital resources for personal finance, market analysis and free trading guides. More about TradersDNA Features: What Does It Take to Become an Aggressive Trader? | Everything You Need to Know About White Label Trading Software | Advantages of Automated Forex Trading


