Rising Crude Production and Imports Signals Potential Inventory Problems Ahead
Oil prices climbed after the latest Energy Information Administration data discussing trends in crude oil inventories, production, and imports was released Wednesday. Despite inventories falling once more, marking the 9th straight week of drawdowns, the rise in gasoline stockpiles accompanied by higher production and imports all indicates that crude continues to flood the global economy. Even after significant supply disruptions over the last few months and heightened summer demand, a massive production overhang looms over markets, in a development that could send oil prices breaking lower. Rising OPEC production combined with revived Libyan exports and recovering production could quickly unbalance the market in spite of weaker Nigerian production. Although oil inventories have declined noticeably over the last several months, should global oil and gasoline demand remained growth remain subdued, stockpiles could rapidly pile up once more, denting the outlook.
Rising Gasoline Output Meets Slower Demand
Following the inventory figures released Wednesday afternoon, oil prices erased all earlier losses, managing to rally modestly after the perceived US inventory glut declined for the ninth straight week. However, two rather disturbing trends have emerged. For one, the 911,000 barrel build in gasoline inventories could reflect rising refinery output and greater inflows from Chinese refiners looking for destinations for gasoline, which may include US storage facilities as they await a buyer. After relaxing restrictions on “teapot refiners“, a term for independent refinery operators, some estimates show gasoline output in China outpacing demand by as much as 9.00%, indicating that refined products are rapidly making their way to export markets across the globe. With refining production that has largely risen across the globe, the stage may be set for a serious plunge in prices should inventories fill, hurting refiners and seeing higher cost production potentially exit.
The second serious development in the oil patch that is threatening another round of prices declines is decelerating demand growth alongside rising global production. After ending a longstanding feud over rights, Libyan exports have resumed and domestic production is being revived. While oil bulls will continue to point to Nigeria as a risk factor along with falling US production after low prices drove many horizontal drillers to shutter operations, production from the Gulf is on the rise, with output of approximately 32.9 million barrels per day in June OPEC is managing to fill in the gaps left by weaker production elsewhere. Revised EIA demand forecasts for 2016 indicate slowing growth, further hurting the bullish supply disruption thesis. While China and India are forecast to be a major component of 2017 demand growth, any economic disappointments could see the optimistic expectations miss widely.
Falling Volatility Indicates Potential Breakout Activity Ahead for Crude Oil
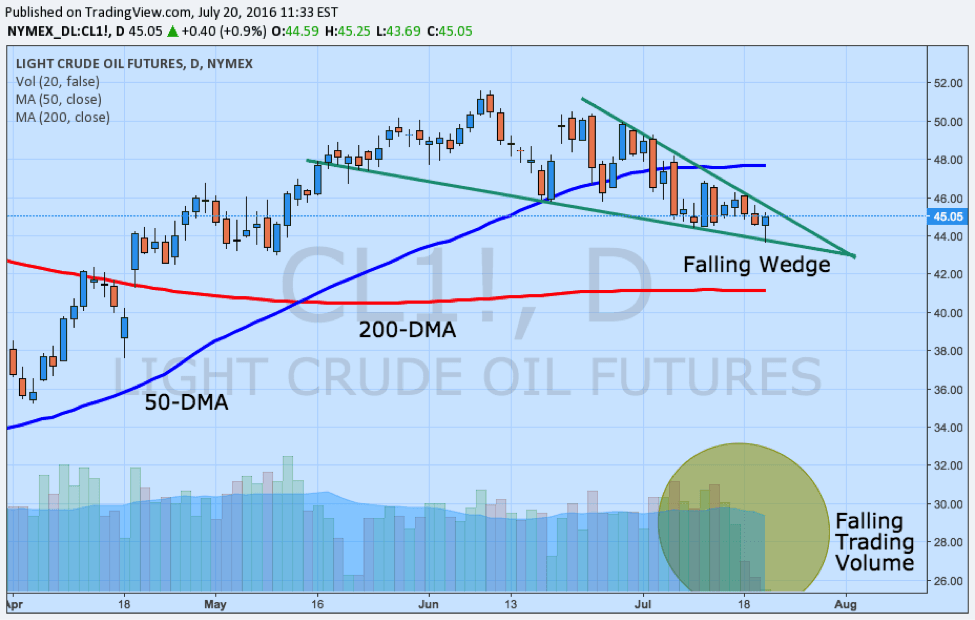
Crude oil prices have spent a considerable period of time consolidating over the last month and based on emerging trends looks to be on the approach of a directional breakout based on several key indicators. For one, even though intraday volatility remains significant in comparison to other asset classes, the narrowing price range combined with falling trading volumes suggests that prices could soon make a move. Although some technical traders would look at the price action within the context of a falling wedge, a traditional bullish continuation pattern in this particular setup, other indicators give a more mixed view of price action. The moving averages for instance are giving credence towards changing momentum as the 50-day moving average acts as resistance on the upside while the flattening 200-day moving average signals a potential oncoming shift while serving as support.
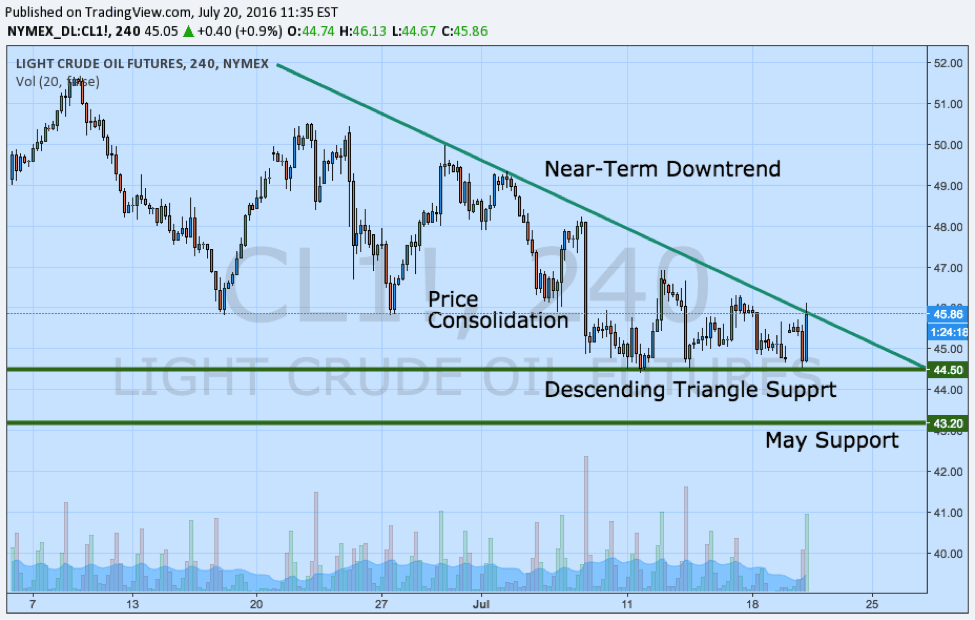
On a shorter-term 4-hour chart, the emergence of a bearish descending triangle setup is strong indication that the bearish case outside of the fundamentals is also relevant. The downward trend of the last month combined with firm support at $44.50 per barrel form the basis for the triangle, highlighting the ongoing price consolidation and falling trading volumes. While bullish momentum from the inventory data may test the downtrend line, without a clear close above the level, the pattern remains intact. A solid close below support could be early signs of a downside breakout targeting support at $43.20 last seen in May. However, any candlestick close above the trend line would indicate a failed pattern and potentially the resumption of the medium-term upward trend as suggested by the falling wedge pattern.
Looking Ahead
Further builds in gasoline inventories and signs that oil demand growth is set to fall further could spark another round of substantial losses in crude oil prices. The gasoline glut could quickly see refinery demand drop should refiners be unable to store their excess production in the US or find buyers abroad for surplus output. Should gasoline capacity completely fill, oil stockpiles, which have managed a noteworthy inventory reduction over the last 9-weeks, may rapidly see the trend reverse as onshore storage anxiety climbs once more. A reversal in stockpiling may only come about should Indian and Chinese demand growth meet expectation. Until then, weak demand expansion will remain outstripped by climbing global supply, potentially leading to a downside breakout in oil prices.
Tradersdna is a leading digital and social media platform for traders and investors. Tradersdna offers premiere resources for trading and investing education, digital resources for personal finance, market analysis and free trading guides. More about TradersDNA Features: What Does It Take to Become an Aggressive Trader? | Everything You Need to Know About White Label Trading Software | Advantages of Automated Forex Trading