
Extracted from Jefferies Equities White Paper 2019
In 2018, it was particularly fitting that the song Everything is Awful was written by The Decemberists. After the worst December since 1931, and in the absence of a single clear catalyst, we are taking a step back to reflect on what went wrong (most things), what went right (not much) – and what may have contributed to this. To better understand the landscape, we are looking at how much has changed in recent years.
Let’s start with a comparison. For decades, football players have played their game on a 100-yard gridiron. The rules are clear – if complex – and more or less endure over time.
But what would happen if these football players showed up and realized their field had turned into a baseball diamond? Not overnight, but over time and bit by bit – the parameters, size and shape of the turf morphed into something else entirely? They would still know how to dominate a football field, but other changes would mean the game, the rules and the very ground they played on had changed considerably.
What if that is what’s happened to trading and execution over the last decade?
Since the global financial crisis, the terrain of investing, trading and execution has changed so considerably that it’s possible participants are playing a much different game than when they logged onto their Bloomberg terminals in the mid 2000s.
When the Market Moves the Market will explore a number of these shifts including:
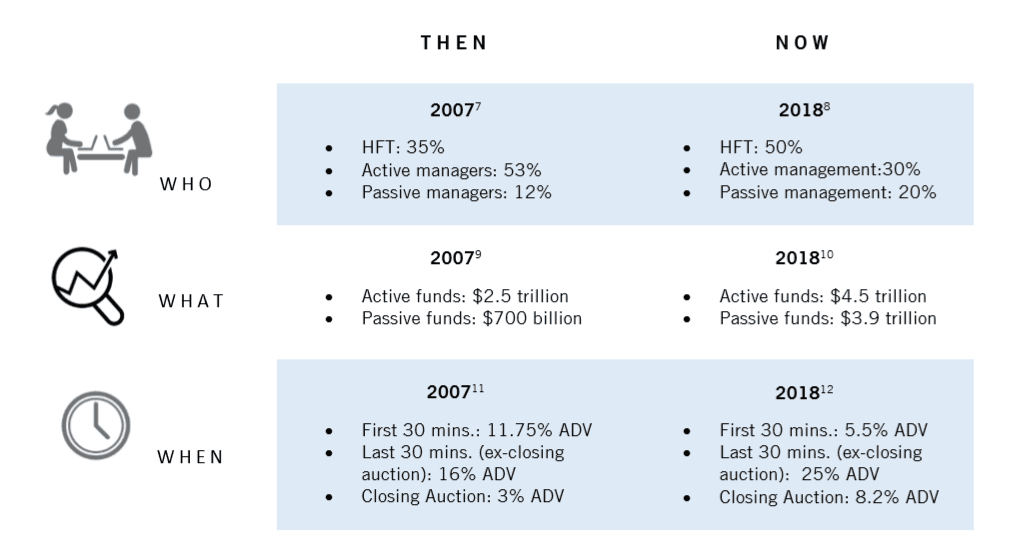
- Who is trading. One of the biggest shifts in market structure has been the move from “who” is trading…to what is trading – meaning who (or what) is most active in the market. Non-rules based actors now likely account for less than 30% of daily volume.
- What they’re trading. Growth of products and decline in trading costs have seen ETFs and other indexed products soar from less than $700 billion pre-crisis to more than $5 trillion in 2018 – while the number of publicly traded U.S. companies waned.
- When they’re trading. The open and end of day have long been critical trading junctures. But a number of factors has concentrated even more trading in the last 10 minutes of the day and closing auction – NYSE closing auction share of NYSE-listed trading (the world’s most liquid equity market) now tops 8%.
- How they’re trading. High frequency volumes have receded from their immediate precrisis highs, but still comprise about 50% of daily volume
- Where they’re trading. Regulation, fragmentation and expansion of markets means that traders can execute on one of over 200 venues globally, and
- How these factors may combine.
Other topline findings:
- Active managers represented 53% of the market in 2007, shrinking to just 30% in 2018. Conversely, the number of passive managers has increased from 12% to 20%.
- Of active managers, it is estimated that only 10% of daily trading is initiated by fundamental discretionary investors – those who ground buys or sells on fundamental analysis.
- The AUM of passive funds has exploded from $700 billion in 2017 to $3.9 trillion in 2018.
- High frequency trading has increased, and now comprises 50% of the daily volume of securities traded.
- Average daily volume of shares traded has increased in last 30 minutes of the trading day.
- The number of listed companies in the US has nearly halved in 20 years, whilst the number of investors has grown – this has changed the nature of asset allocation. The list of tickers that make up the market is simplifying or shortening – while market structure is becoming more dimensional, complex, and multi-faceted.
- Investors are making more thematic investment decisions rather than focusing on a single firm, helped by ‘bucketing’ firms into indices
- Exchanges play a role in shaping trading patterns through their strategic pricing models and market designs. With policy led by MiFID II, the number of exchanges in the US has multiplied, meaning each exchange trades a smaller tranche of the pie. Of note, dark pool trading has increased from 2% in 2006 to 15% in 2018.
That things have changed in the investing, trading and execution landscape is news to no one. But the magnitude of multiple changes has been appreciated by a smaller group of investors – and an even smaller group still knows how to effectively navigate these far reaching and ongoing changes.
When the Market Moves the Market examines these changes – some obvious, others more subtle. It explores how much has changed – and what some of the implications of these shifts have been. Much of this piece focuses on the global equity markets, but the changes in the currency, commodity, fixed income or derivative markets have been no less severe. We do not take a stand on whether these changes have been positive or negative; rather, that in aggregate they result in a considerable shift in investing over the last decade.
Tradersdna is a leading digital and social media platform for traders and investors. Tradersdna offers premiere resources for trading and investing education, digital resources for personal finance, market analysis and free trading guides. More about TradersDNA Features: What Does It Take to Become an Aggressive Trader? | Everything You Need to Know About White Label Trading Software | Advantages of Automated Forex Trading


