In the second part of our series on forex trading with candlestick charts, we’ll be looking at one of the most useful candlestick formations – Doji – and what these can signify in terms of future price action.
The word itself is derived from the Dojima Rice Exchange in Osaka, the first rice exchange in Japan and an early precursor to the Japanese stock exchange of today. Some of the earliest technical analysis techniques were developed by Japanese rice traders, including candlestick charts. The word ‘Doji’ can be singular or plural.
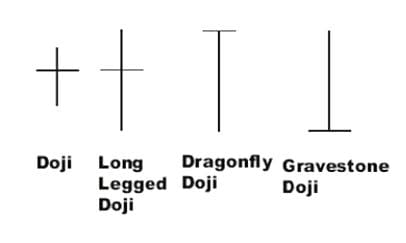
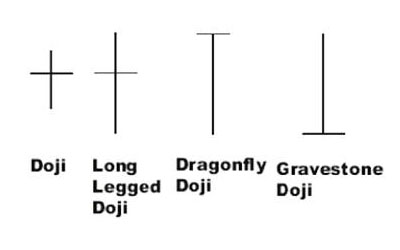
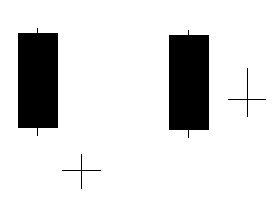
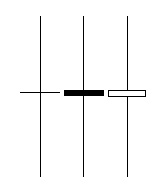
As you can see from the examples above, Doji are candlesticks that have a very narrow real body. This means that the open and close price are virtually equal, or at least very close together. The length of the shadows can vary, resulting in shapes that look like a plus sign, a cross, or an inverted cross.
Taken in isolation, Doji formations don’t give bullish or bearish indicators. However, when viewed in a wider context, taking into account previous candlestick formations, they can be powerful tools for determining the likely future price action movement.
The open and close price associated with a Doji formation should ideally be equal, although this doesn’t matter as much as the overall shape of the candlestick and the securities being traded. What Doji signify is a tug-of-war, or a stalemate, between buyers and sellers. During the session, prices will move above and below the opening level, but end up at roughly the same point as the open. This means that neither buyers nor sellers were able to get the upper hand during the session, indicating that a turning point could be forthcoming.
The criteria for the robustness of a Doji vary depending on the security being analysed. For example, in equities trading, a $10 stock might form a Doji with 1/10th of a point’s difference between open and close, whereas a $100 stock might form one with one point’s difference. This is less of a concern for forex traders, where all the major currencies tend to trade within an established range, but it is worth keeping in mind nonetheless.
The robustness of the Doji depends on the price, previous candlesticks, and the recent volatility levels. In order to be considered significant, the Doji should have a small body that appears as a thin horizontal line, which should be noticeably thinner than the bodies of preceding candlesticks. So, a doji following among candlesticks that also have very short bodies would not necessarily signify anything other than a stagnant market, whereas a doji forming after candlesticks that have long bodies could prove to be an important indicator.
Using Doji to Identify Reversals
After a long hollow candlestick, which signifies a price advance, a Doji shows that the buying pressure is weakening. Coversely, after a long filled candlestick, which indicates a decline, a Doji indicates that the selling pressure is on the wane. In general, Doji show that the forces of supply and demand are evening out, and that a change in the trend may be looming. However, they do not provide a solid indication that a reversal has started, and can only ever provide part, albeit a very useful part, of the picture.
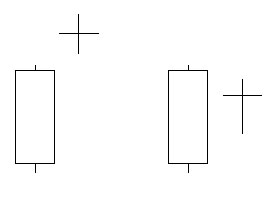 In the case of a Doji after a long white candlestick, a Doji can mean that buying pressure is on the way down and that the end of the uptrend may be nearing. While a security can decline from a lack of buyers, an uptrend requires continued buying pressure to be sustained. That’s why a Doji can be more significant after an uptrend (long hollow candlestick) than after a downtrend (long filled candlestick). However, a bear trend is only confirmed when a doji is followed by another downside indicator, such as a gap down, a long candlestick, or decline below the open of the long holow candlestick.
 After a long filled candlestick, indicating a decline, a Doji might indicate that the selling pressure may be on the wane and that the downtrend may be coming to an end. However, even though this shows that sellers are beginning to lose control over the decline, the reversal would not be confirmed without another indicator of bullishness, such as a gap up, an advance above the open of the long filled candlestick, or a long hollow candlestick.
Long-legged Doji are characterised as having upper and lower shadows that are similar in length, and they indicate a high level of indecision in the market. Basically, they mean that prices moved a long way above and below the opening level, but closed at around the same level as the open.
Dragon Fly Doji
A dragon fly Doji forms when the opening price, the session high, and the closing price are roughly equal and the low creates a long shadow, and look a bit like a ‘T’ with a long low shadow and no upper shadow. These indicate that sellers dominated trading during the early part of the session, but also that buyers came back into the market towards the end of the session to push prices back where they were at the open.
A dragon fly Doji can indicate a reversal, depending on previous candlesticks and future confirmation. The long lower shadow shows that buying pressure is evident, but also that there are still plenty of sellers in the market. After a long filled a candlestick, a long downtrend, or at a support level, a dragon fly Doji could signal a bottom, or a potential bullish reversal. Conversely, after a long hollow candlestick, a long uptrend, or at a resistance level, a long lower shadow could mean a bearish reversal is around the corner. However, confirmation from the next candlestick would be required for a dragon fly Doji to signify a reversal.
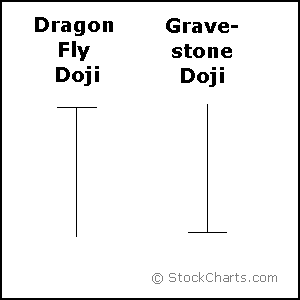 Gravestone Doji
A gravestone Doji looks like an upside down ‘T’ with a long upper shadow and no lower shadow. These are formed when the open, low and close are equal, and the long upper shadow is generated by the session high. These show that buyers dominated trading during the session, but also that by the end of the session sellers had returned to the market to push the price back to the opening level and the session low.
As with other types of Doji such as the dragon fly, a gravestone only indicates a reversal in the context of previous price action and future confirmation. While the long upper shadow indicates a failed rally, the session high does show some buying pressure. After a long filled candlestick, a long downtrend, or at a support level, a gravestone may indicate increased buying pressure and signs of a future reversal. Conversely, after a long hollow candlestick, a long uptrend, or at a resistance level, it may indicate increased selling pressure and a bearish reversal. In both cases, confirmation in the form of the next candlestick is required for confirmation.
Other Articles in This Series:
Guide to Forex Trading with Candlestick Charts Part 1
Read More:
is etrade customer service 24 hours
crypto mining tools crypto premier guide
Tradersdna is a leading digital and social media platform for traders and investors. Tradersdna offers premiere resources for trading and investing education, digital resources for personal finance, market analysis and free trading guides. More about TradersDNA Features: What Does It Take to Become an Aggressive Trader? | Everything You Need to Know About White Label Trading Software | Advantages of Automated Forex Trading