
When it comes to spotting trends, two of the most useful indicators are moving averages and MACD. On one hand, these are good ones to use as, when used correctly, they give a pretty good chance of giving the correct signal. On the other hand, because they only spot trends once they have been established, you may miss out on the most profitable part of the trade as a result.
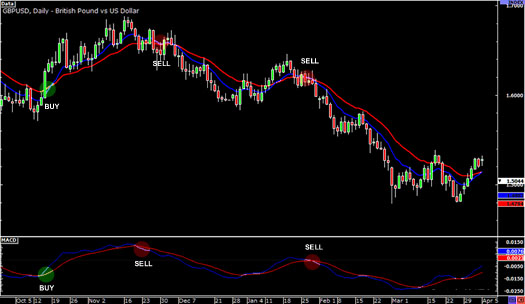
In the daily GBP/USD chart above, we have a 10 period EMA in blue, a 20 period EMA in red, and an MACD along the bottom. In mid-October, the 10 EME crossed above the 20 EMA, a signal to buy. At the same time, the MACD made an upwards crossover, another bullish signal.
If you had followed these signals and placed a buy trade, you would have made a decent profit out of the uptrend that followed.
Later in the chart, both the MACD and the moving averages were giving bearish signals, indicating that it may be a good opportunity to place a short trade. And sure enough, if you had done so, you would have made a decent profit.
However, these crossover signals can sometimes mislead, giving false signals or “fakeouts” – as we can see in the following chart:
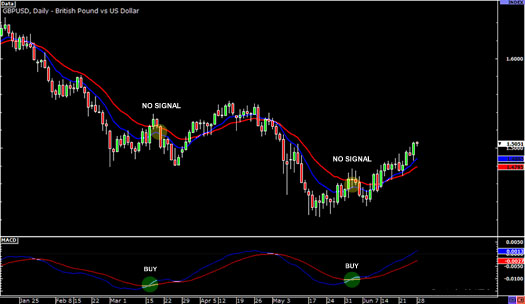
In mid-March, the MACD gave a buy signal, but the moving averages didn’t give any signal. If you had acted on the isolated buy signal from the MACD, you would have been caught out by a fakeout.
By the same token, the MACD’s bullish crossover at the end of May wasn’t matched up with a crossover in the moving average. If you had placed a buy trade at that point, you would have made a loss as the price fell after that.
Tradersdna is a leading digital and social media platform for traders and investors. Tradersdna offers premiere resources for trading and investing education, digital resources for personal finance, market analysis and free trading guides. More about TradersDNA Features: What Does It Take to Become an Aggressive Trader? | Everything You Need to Know About White Label Trading Software | Advantages of Automated Forex Trading


