In the last part of our series on Forex Trading with Fibonacci Ratios, we looked at how to compare support and resistance levels with Fibonacci levels to determine good points to place trade orders. Today, we’ll be looking at combining trendline analysis with the Fibonacci tool, which makes sense given that Fib levels work best when the market is trending.
Combining Trendlines with Fibonacci Retracements
As we have mentioned in previous installments, traders use Fibonacci retracement levels as a tool for getting in on the trend, whether it is an uptrend or a downtrend. Therefore, it makes sense to look for levels where the Fibonacci levels line up with the trend. To illustrate, here is a one-hour chart of the AUD/JPY, where there has been a clear uptrend over the few days. You decide to get in on the action by going long on the pair. 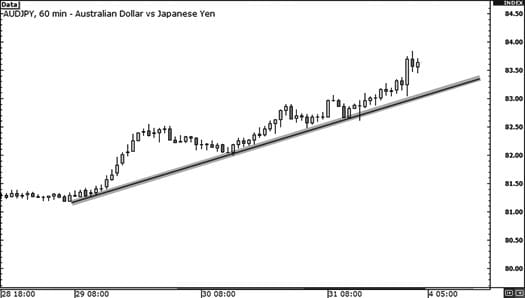 Now, you could enter the trade the next time the price hits the trendline, but by using the Fibonacci tool, you can set the entry price a lot more precisely.
 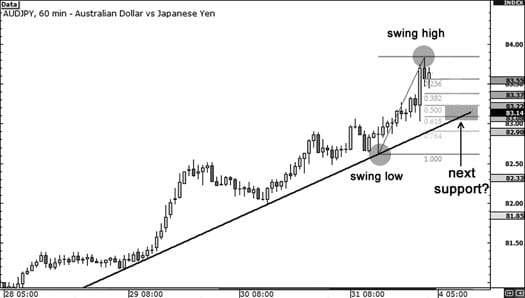 In this case, the Fibonacci retracement levels were set using the Swing High at 83.84 and the Swing low at 82.61. The Fibonacci levels at 50% and 61.8% are intersected by the rising trendline, which suggests that they could potentially serve as support levels.
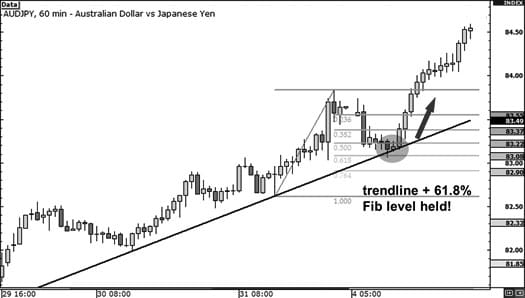
In this case, the 61.8% Fibonacci level held, with the price bouncing there before continuing its ascent. Therefore, if you had set your entry order at that level, you would have maximised your profits on the trade. So, even if you intend to enter on the retest of the trendline, it can be well worth using the Fibonacci tool to help you set your entry point more accurately.
Sticking with the self-fulfilling prophecy theme, if there is a coincidence in the diagonal and horizontal support or resistance levels, it’s likely that a lot of other traders have their eye on it as well. It’s worth remembering though that, in common with other drawing tools, drawing trendlines is far from being an exact science. This is because you never know how other traders are drawing them, only that there is a trend.
Combing Fibonacci Levels with Candlesticks
Another way in which the Fibonacci tool can be immensely useful is if you use it in conjunction with Japanese candlestick patterns, which we looked at in our Guide to Forex Trading with Candlestick Patterns series.
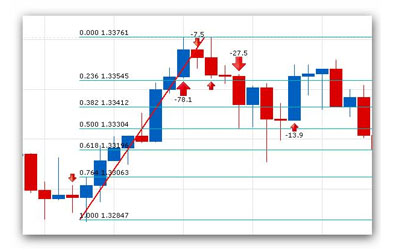
When combining the Fibonacci tool with candlestick patterns, what we are looking for are exhaustive candlesticks – signs that buying or selling pressure is exhausted, that hint at when price may resume a trending pattern. Here is an example to demonstrate:
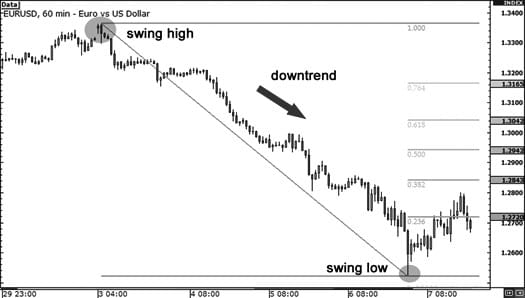
In the chart above, the EUR/USD has been in a downtrend for the last week, but the move seems to have paused. In order to see if there is still a chance to get in on this downtrend, we use the Fibonacci tool, setting the Swing High at 1.3364 on March 3rd and the Swing Low at 1.2523 on March 6th.
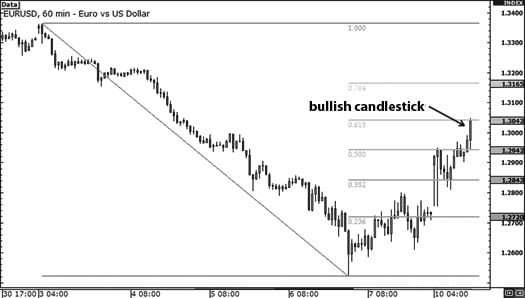
When you return to the chart after the weekend, you notice that the EUR/USD has gone up by quite a bit. Although the 50% Fib level was held for a while, buying pressure eventually pushed the price beyond this area. Given that the most recent candlestick was very bullish, you decide to wait and see whether the 6.8% Fibonacci level holds or not.
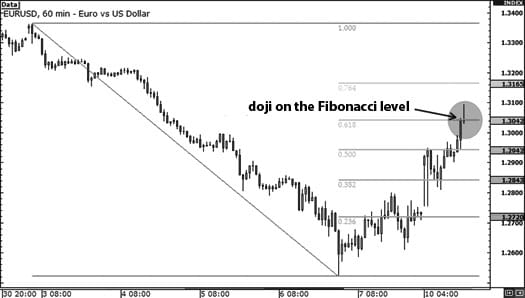
As we can see, a long-legged doji has formed on the 61.8% Fibonacci level. Long-legged doji are exactly what we are looking for – an ‘exhaustive candle’, suggesting that buying pressure has died down and that resistance at the Fib level might hold. It’s perfectly feasible that other traders have been keeping an eye on this level, and should act accordingly. Therefore, this represents an opportunity to short that has a better-than-average chance of success.
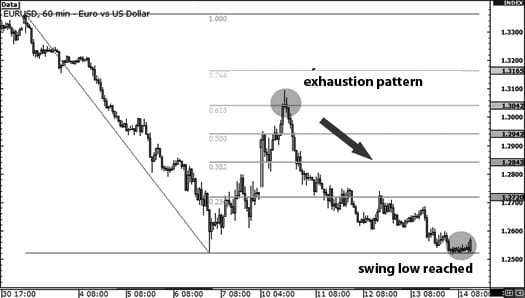
In the event, shorting at that point would have been the right thing to do, as immediately after the doji, the price stalled before plunging to the level of the Swing Low. It looks as if buyers were indeed exhausted at the point of the doji formation, precipitating a move of around 500 pips – which could have been very profitable indeed!
The reason this works is that, if the price is stalling on a Fib level, the majority of traders will take that as a cue to place orders at that level, turning the level into an area of support or resistance.
With Fibonacci candlestick formations, you don’t need to place limit orders at Fibonacci levels, although you might want to think about whether the support or resistance will hold since we are looking at an area rather than specific levels. You might want to wait for an exhaustive candlestick to form just above or below a Fibonacci level to provide you with confirmation as to whether you should place an order or not.
If such a candlestick does form, this could be your cue to enter a market order, seeing as you now have more confirmation that the level might hold.
In the next part of our series, we’ll be looking at Fibonacci extensions, and how to use them to set profit targets.
Read More:
Tradersdna is a leading digital and social media platform for traders and investors. Tradersdna offers premiere resources for trading and investing education, digital resources for personal finance, market analysis and free trading guides. More about TradersDNA Features: What Does It Take to Become an Aggressive Trader? | Everything You Need to Know About White Label Trading Software | Advantages of Automated Forex Trading