In the previous lesson, we looked at the differences between reversals and retracements, and some strategies to use when you are unsure. Today, we shall be looking in more depth at how to detect these with more accuracy. If you can distinguish between a retracement and a reversal with any degree of reliability, it can help in reducing the the number of losing trades, and can also help you to identify some winners.
There are several distinguishing features of retracements that set them apart from reversals. These are:
Retracements usually happen after big price movements, whereas reversals can occur at any time.
Retracements are short-term and short-lived, whereas reversals are long term price movements.
Reversals tend to occur as a result of changing fundamental factors, while retracements can occur when the fundamentals remain the same.
When a retracement occurs when price is trending up, it means there is more buying interest than selling interest, which means that price is likely to rally. In a downtrend, selling interest is present, making it likely that the price will decline. However, when price is trending up and then reverses, there is little buying interest, which pushes the price down. In the reversal of a downtrend, the lack of selling interest makes it unlikely that the price will rise further.
Identifying Retracements with Fibonacci Levels
One way to identify retracements is to use Fibonacci levels. In most cases, price retracements occur at the 38.2%, 50.0% and 61.8% Fibonacci retracement levels before continuing the overall trend, as these are the levels watched by most traders. If the price goes significantly beyond these levels, it may indicate a reversal in progress.
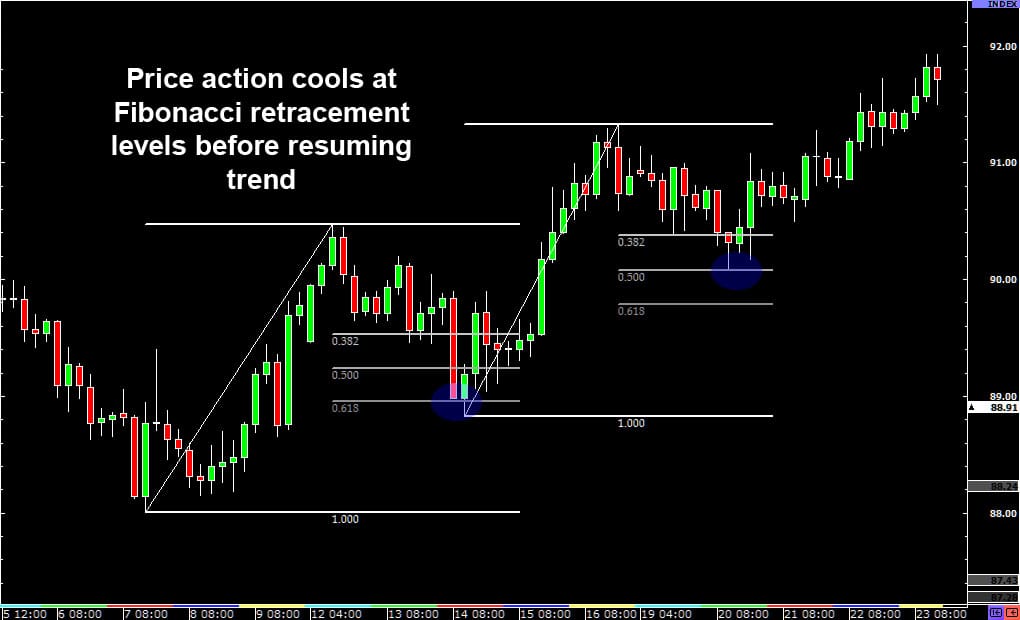
In the chart above, price cooled off after hitting the 61.8% Fibonacci retracement level before the uptrend was resumed. After a fashion, it pulled back again, settling briefly at the 50% level before continuing the uptrend.
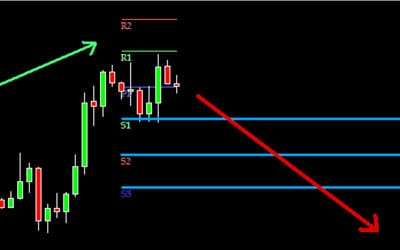
Identifying Retracements with Pivot Points
You can also sometimes detect a reversal using pivot points. When price is trending up, traders look to the lower support points (S1, S2, S3) and wait for them to break. When price is trending down, traders will look at the higher resistance points (R1, R2, R3) and wait for them to break.
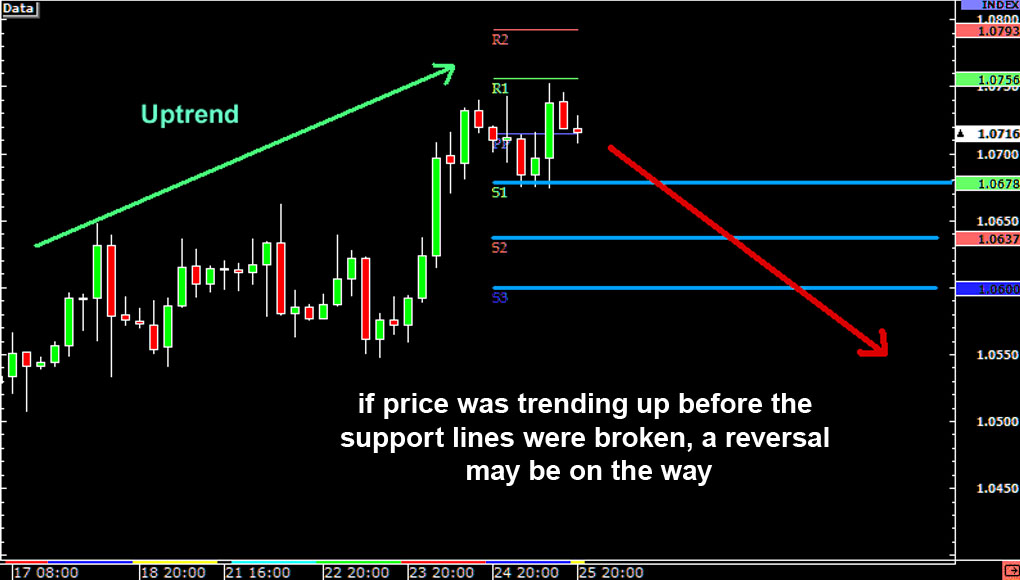
When these levels break, it can signal a reversal is on the way.
Using Trend Lines to Detect Reversals
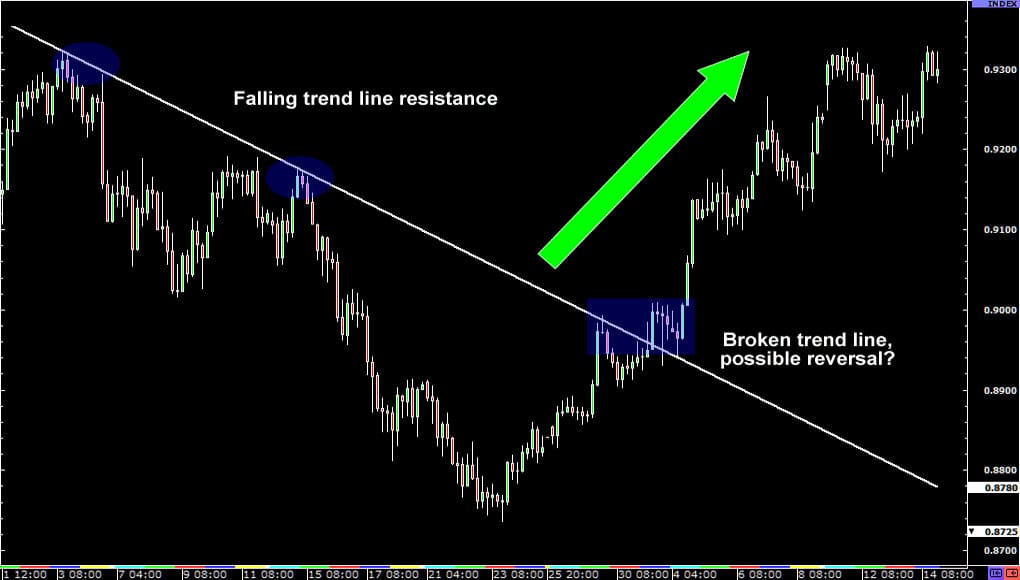
When a major trend line is broken, it can signify a reversal. By using this tool together with candlestick chart patterns, you can identify reversals with some degree of accuracy.
Read More:
when is the target car seat trade-in 2025
Tradersdna is a leading digital and social media platform for traders and investors. Tradersdna offers premiere resources for trading and investing education, digital resources for personal finance, market analysis and free trading guides. More about TradersDNA Features: What Does It Take to Become an Aggressive Trader? | Everything You Need to Know About White Label Trading Software | Advantages of Automated Forex Trading