Moving Averages in a Trending Market
The ADX can be a useful tool for determining the strength of trends, but it’s more reliable if you use it in conjunction with a couple of other indicators, and simple moving averages can be among the most useful in this respect.
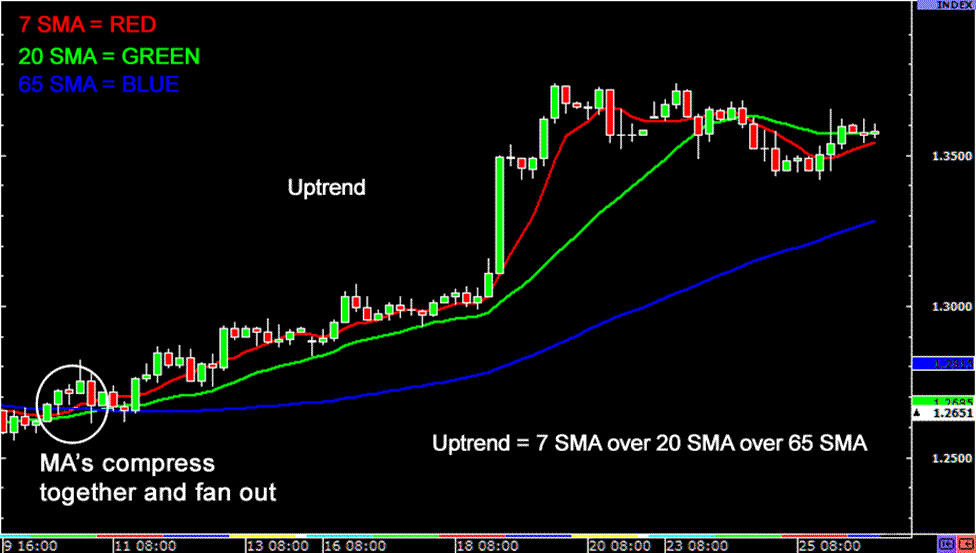
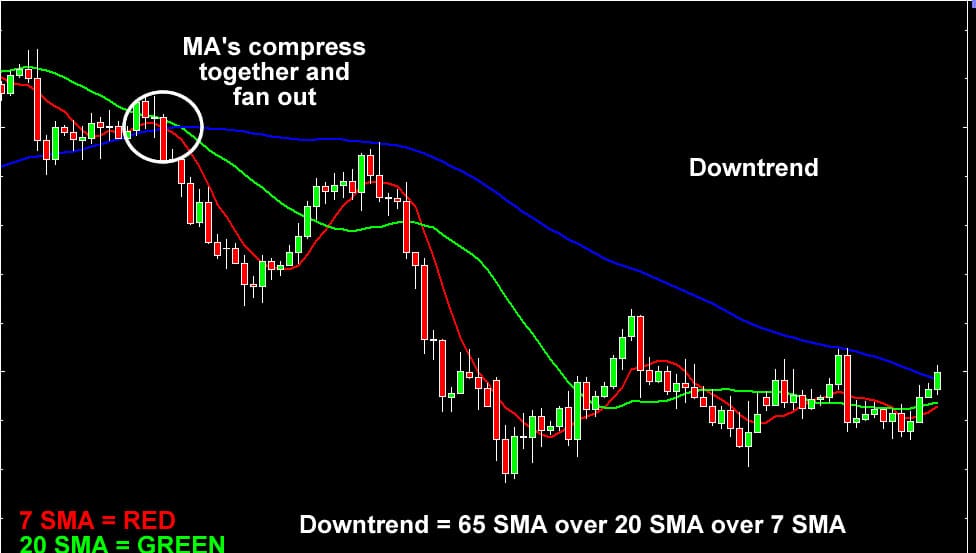
To detect a trend, place three SMAs on your chart – a 7 period, a 20 period, and a 65 period. Then, keep an eye on the chart for when the three SMAs compress together and then start fanning out – this means an trend is starting.

In the above example, we see the 7 period SMA fanning out above the 20 period SMA and the 65 SMA – a clear sign that the price is trending up.

However, in this one the 7 period SMA is fanning out below the 20 period SMA, and the 65 SMA is below that, which indicates that the price is trending downwards.
Bollinger Bands
Bollinger bands are another tool that can help us to detect trends.
It’s important to remember that trends are a relatively rare phenomenon, and that around 75% of the time, most currency pairs trade within a range.
Common sense would dictate that whenever prices deviate from the norm of range trading, then a trend is in progress. Therefore, it is a good idea to use an indicator that measures deviation – and Bollinger Bands are perfect for this.
The fact that the formula for standard deviation is included in Bollinger bands means that they have a direct correlation with the amount of deviation inherent in the price action.
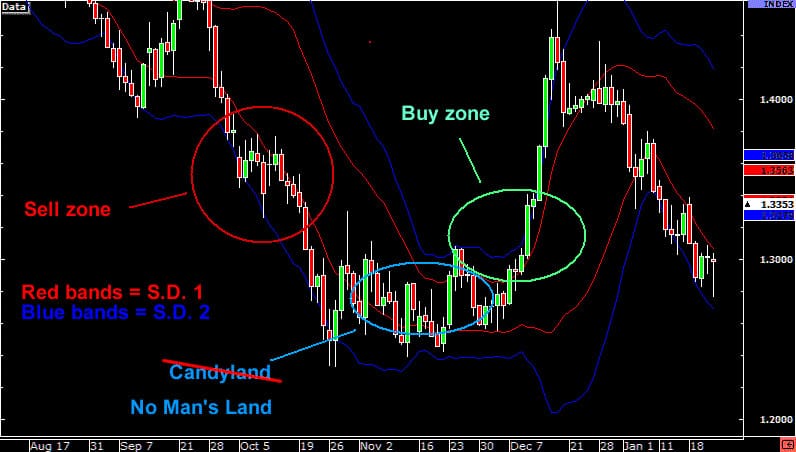
To detect a trend with Bollinger bands, set up bands with a standard deviation of 1 and a standard deviation of 2. This will create three zones within your graph – a ‘buy’ zone, a ‘sell’ zone, and the space in between.

In the chart above, the sell zone is located between the two lower bands of the first standard deviation (S.D. 1) and the second standard deviation (S.D. 2). In order to be considered as being within the sell zone, the closing price has to be between these bands.
The buy zone can be found between the top bands of S.D. 1 and S.D. 2. As with the sell zone, the price has to close between these two bands to be in the buy zone.
The area in between the S.D.1 bands is the area in which the market lacks direction. If the price could go either way, then you will find it in this area.
What Bollinger bands do is to make it easier to confirm a trend, because ddwntrends can be confirmed when price is in the sell zone, and uptrends can be confirmed when price is in the buy zone.
Tradersdna is a leading digital and social media platform for traders and investors. Tradersdna offers premiere resources for trading and investing education, digital resources for personal finance, market analysis and free trading guides. More about TradersDNA Features: What Does It Take to Become an Aggressive Trader? | Everything You Need to Know About White Label Trading Software | Advantages of Automated Forex Trading


