Option volatilities are a measure of the magnitude and frequency of the changes in the price of a currency. On the other hand, implied option volatilities measure the expected fluctuations in the price of a currency over a certain period of time, based on the historic volatility of the currency. Usually, volatility calculations involve the annual standard deviation of daily price changes.
You can find out information about option volatilities from a range of readily-available sources. When using option volatility to forecast future market activity, you need to make certain comparisons. Ideally, you would be able to compare actual volatility with implied volatility, but the limited availability of actual volatility data can make this tricky. An effective alternative is to compare historical implied volatilities, with one-month and three-month implied volatilities being two of the most commonly-used time frames for comparison. .
If short-term option volatilities are a lot lower than long-term volatilities, a breakout could be imminent. If, however, short-term option volatilities are significantly higher than long-term volatilities, a reversion to range trading could be on the cards.
In a range-trading scenario, implied option volatilities are usually low or declining because there tends to be minimal movement during these periods. When option volatilities decline sharply, it can signal a trading opportunity. This will be of great interest for range and breakout traders.
Range traders who sell at the top of the range and buy at the bottom can use option volatilities to predict when the strategy is likely to cease to be effective – specifically, if volatility contracts become very low, then it is less likely that the range trading pattern will continue.
Breakout traders can also use option volatilities as an extra indicator to prevent them from buying or selling into a false breakout. If volatility is very low, then the chances of a real breakout happening increase. Although these guidelines are usually quite reliable, you need to be careful with them because volatilities can have long downward trends, during which time volatilities can be misleading. What you need to look out for are sharp movements in volatilities, as opposed to gradual ones.
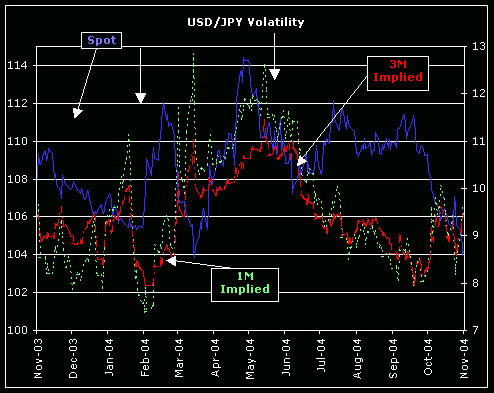
Here, you can see a chart of USD/JPY, with short-term volatility shown in green, long-term volatility in red, and price action in blue. The two arrows that do not have labels attached point towards times when short-term volatility rose significantly above long-term volatility. These divergences in volatility tend to be followed by periods of range-trading. The “1M implied” arrow points to a period when short-term volatility dips below long-term volatility. When the price action rises above that level, short-term volatility reverts to long-term volatility and a breakout occurs.
Tradersdna is a leading digital and social media platform for traders and investors. Tradersdna offers premiere resources for trading and investing education, digital resources for personal finance, market analysis and free trading guides. More about TradersDNA Features: What Does It Take to Become an Aggressive Trader? | Everything You Need to Know About White Label Trading Software | Advantages of Automated Forex Trading


