
This is a guest Post by Felipe Domarchi. Felipe Domarchi was born in Santiago de Chile. He earned a Bachelors degree in Economics from Jonkoping International Business School and a Masters degree in Finance from Lund University of Economics and Management.
After completing his academic education, he worked for several financial institutions in Frankfurt and is currently a Senior Analyst with Scandinavian Capital Markets based out of Gothenburg.

…………………………………………………..
From late November 2012 until now, the run in the risk-on pair USD/JPY has been quite staggering. Mr Market has anticipated more dovish monetary policy by the BOJ (Bank of Japan) which has resulted in a considerably weaker Yen. The changes in monetary policy presented the 22nd of January, includes a medium term inflation target of 2% with an open-ended quantitative easing program (QE) with start January 2014. The new measures put in place were anticipated by the market, which lead to a “buy the rumor sell the fact” type of trading the days after the release.
The new prime minister of Japan, Mr. Abe, has made it clear that he wants a significantly weaker Yen, and many speculate that he won’t be satisfied until the USD/JPY reaches the 100 level.
There has been a great deal of comments from Mr. Abe about the commitment of the new government. The market is anticipating a more dovish BOJ governor than the current ”pigeon” Mr. Shirakawa, who is set to step down from his post in late March 2013.
Intermarket analysis:
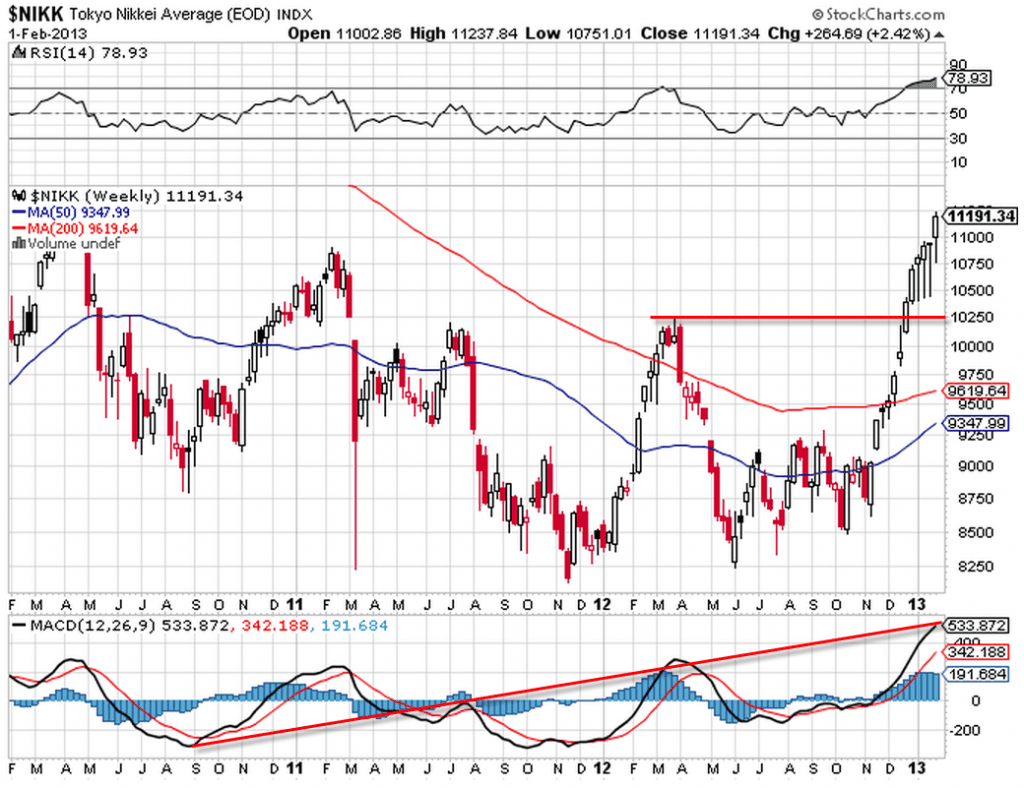
As the above example shows, the weekly Nikkei index chart shows a remarkable bullish sentiment in the Japanese stock market. The MACD is approaching a resistance line derived from previous tops and one trough. By looking at the chart we understand that the bullish trend started late 2012 and continued throughout January 2013, coinciding with the strong run in USD/JPY. Any pullback is expected to find support at 10250.
The S&P500 which we use to track overly market sentiment has also been rallying in the first month of 2013. Under late 2012 one can clearly see, that Mr. Market was hesitating to follow through with a bullish move similar to the one in Nikkei mainly due to Fiscal cliff and debt ceiling negotiations.
SPX might be topping out soon as it has been rising in a wedge clearly illustrated in the chart which might indicate that a downfall is near. A close under 1474 will hurt the risk sentiment in currency markets.
Conclusion:
As the USD/JPY daily chart illustrates, we currently have an inverted H&S formation in place where the upper target of the bullish breakout is 95. Current price is hovering around the 93.29 level and a pullback might be expected before reaching 95 which would give good opportonities for a few long positions. However, any exogenous economic shock to the US economy would most likely change this picture and spark a risk-off style reversal. If that’s the case, one could be eyeing at the weekly 10 year US treasury yield chart for a reversal under 1.80% of the current breakout. That means, the rally still seems to have legs, unless anything unforseen happens to the economy in the short term.
Tradersdna is a leading digital and social media platform for traders and investors. Tradersdna offers premiere resources for trading and investing education, digital resources for personal finance, market analysis and free trading guides. More about TradersDNA Features: What Does It Take to Become an Aggressive Trader? | Everything You Need to Know About White Label Trading Software | Advantages of Automated Forex Trading