Finding good charting tools that don’t cost a fortune is a big deal for anyone watching the markets. Bad charts make it tough to see what’s really going on, and that can mess up your trading plans. I’ve spent time looking at a bunch of free charting software to see which ones are actually useful. My goal was to find platforms that give you solid features without asking for your wallet. Whether you’re just starting out or you’ve been trading for a while, this list of the best free charting software for 2026 should help you find what you need. Many online brokers have their own charting tools, but sometimes a separate charting website is just easier to use for quick checks or when you’re not logged into your trading account. These five are the ones that really stood out for their free options.
Key Takeaways
- TradingView: This is a really popular choice, known for its clean look and a good set of tools for free users. It’s great for technical analysis and has a big community.
- ProRealTime: If you want a lot of indicators without paying, ProRealTime is a strong contender. Its free version is quite generous, letting you use many features that others charge for.
- StockCharts: This platform has been around for a while and offers a straightforward approach. It’s good for those who like a simpler interface and some solid educational content.
- Yahoo Finance: Most people know Yahoo Finance for news, but its charting tools are surprisingly good for free. It offers real-time data and is easy to access.
- Koyfin: Koyfin is a bit different, focusing on combining fundamental data with charting. It’s a good option if you like to see the bigger financial picture alongside price action.
1. TradingView
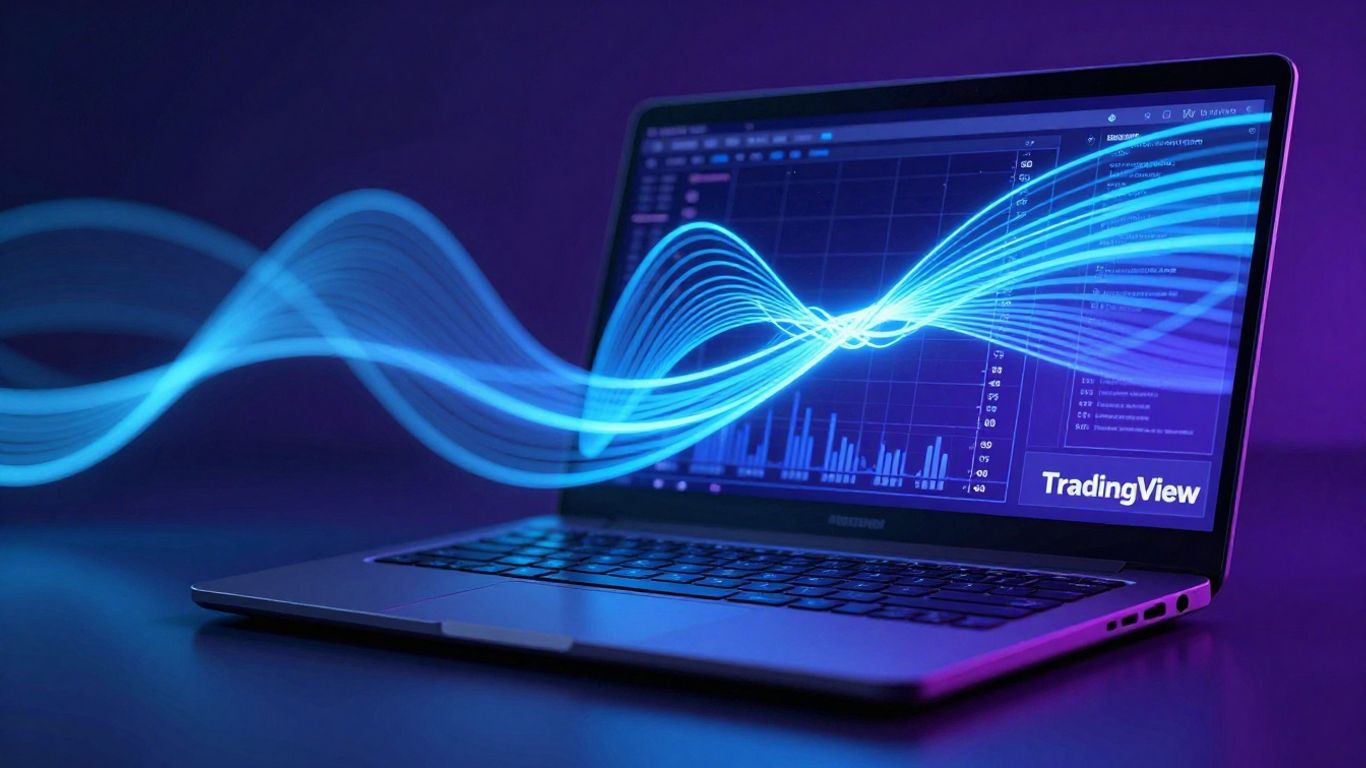
TradingView is a pretty popular choice for charting, and honestly, it’s easy to see why. It started with a group of developers and traders who just wanted to make charting tools that were both simple and powerful, something anyone could use. They really leaned into cloud tech and browser stuff, so now you can get these interactive charts right in your web browser, no downloads needed. It’s also become this huge social hub for traders. People share ideas, charts, and even work together on strategies. It’s a neat way to see what others are thinking and learning from them.
TradingView really sets the bar for what online charting should be. It’s used by millions, and a lot of brokers even use their tech for their own platforms. The charts themselves are super detailed. You get hundreds of pre-built indicators, and then there’s this massive library of scripts made by the community, thanks to their Pine Script language. Little things make a difference too, like the command search that finds tools fast, or how the ticker box remembers what you looked up. It just makes the whole process smoother.
Here’s a quick look at what you get:
- Extensive Indicators: Over 400 built-in and thousands more from the community.
- Social Community: Share ideas, scripts, and forecasts in real-time.
- Bar Replay: Test your strategies on historical data.
- Broker Integration: Trade directly from the charts with supported brokers.
- Cross-Platform: Access on web, desktop, and mobile.
The free version is pretty good to start with, giving you access to the main charting tools and global market data. You will see ads, though, and you’re limited to one chart per tab and just two indicators at a time. It can be a bit restrictive if you like to layer a lot of analysis, and you might see prompts to upgrade now and then. Still, for basic charting and market tracking, it’s a solid free option.
There are paid plans too, starting around $14.95 a month, which get rid of ads and give you more charts and indicators per screen. But for many, the free tier is more than enough to get a good look at the markets.
2. ProRealTime
ProRealTime is a charting platform that’s been around since 2001, and it’s got a pretty big user base worldwide. What’s cool about their free version is that it doesn’t really hold back on the charting tools. You get unlimited technical indicators, you can set up multiple chart layouts, and there are no annoying ads or pop-ups telling you to upgrade. It’s designed to be a clean space for looking at charts.
The interface is pretty straightforward, which is nice when you’re trying to focus on the market. You can arrange your charts however you like, and adding indicators or drawing tools is simple enough. It feels responsive even when you have a bunch of things going on.
Here’s a quick look at what you get:
- Extensive Charting Tools: Access to a wide range of indicators and drawing tools to analyze price movements.
- Customizable Layouts: Arrange multiple charts and watchlists to fit your trading style.
- No Ads or Upgrade Prompts: A clean, distraction-free charting environment.
- Paper Trading: Practice your strategies without risking real money.
ProRealTime’s free offering is quite generous, especially when you compare it to other platforms that often limit features to paid tiers. It’s a solid choice for anyone who needs robust charting capabilities without the cost.
3. StockCharts
StockCharts.com has been around for a while, and it’s got this really solid following, especially with folks who are super into technical analysis. It might not look as slick as some of the newer platforms, but it’s known for being dependable and having a ton of educational stuff. They actually have two ways to chart: the old-school "SharpCharts" and a newer one called "StockChartsACP." SharpCharts is great for making charts that look good enough to put in a report or share easily, while ACP is more like what you’d expect from modern software, with drag-and-drop features.
What really makes StockCharts stand out, though, is all the learning resources. Their "ChartSchool" is basically a massive library of information on technical analysis, and you’ll find commentary from some big names in the field. Another cool tool is "PerfCharts," which lets you see how different parts of the market have performed against each other over time. It’s a neat way to spot trends.
Here’s a quick look at what you get with their plans:
- Free: You can make charts with daily and weekly data, but no intraday. You’re limited to 3 indicators per chart and can’t save anything or make watchlists.
- Basic ($19.95/mo): This adds intraday data, lets you save up to 1,000 charts, bumps the indicator limit to 25, and gives you 1 custom scan.
- Extra & Pro ($29.95/mo – $49.95/mo): These offer real-time data options and deeper historical data.
While the interface might feel a bit old-fashioned compared to some others, StockCharts offers a depth of educational content that’s hard to beat. It’s a platform that respects the fundamentals of technical analysis.
If you’re looking for a place with a lot of history and a strong educational component, StockCharts is definitely worth checking out. You can explore some of the top free stock chart websites, including StockCharts, to see how it compares to other options.
4. Yahoo Finance

When you think about checking stock prices online, Yahoo Finance probably comes to mind pretty quickly. It’s been around forever, and for a lot of people, it’s the first place they go to get a quick look at the market. It’s super easy to use, which is a big plus if you’re just starting out or if you don’t want to mess with complicated software.
You can pull up a basic chart in seconds, see the latest news, and check company financials without needing to sign up for anything. But don’t let its simplicity fool you. If you click on the "Full Screen" option for the charts, you’ll find a lot more under the hood than you might expect. They’ve packed in a bunch of technical indicators, like Bollinger Bands and moving averages, and it even tries to spot chart patterns for you, which is handy for spotting potential trading setups.
One thing that’s pretty neat is how it mixes in news and company data right alongside the price charts. This gives you a better picture of what’s moving the stock, not just the price action itself.
Here’s a quick look at what you get:
- Real-time stock quotes: See prices as they happen.
- Interactive charts: Over 100 technical indicators are available.
- Unlimited watchlists: Keep track of all the stocks you’re interested in.
- Basic portfolio tracking: Monitor your investments.
Of course, since it’s free, you’ll see ads. And if you want to download historical data or get premium research, you’ll need to pay for one of their upgraded plans. The paid tiers start around $9.95 a month and go up from there, adding things like ad removal and more detailed analytics.
While Yahoo Finance is great for quick checks and getting a feel for the market, it might not have all the bells and whistles for serious, in-depth technical analysis compared to some other platforms. It’s more of a jack-of-all-trades for general financial information.
5. Koyfin
Koyfin is a pretty neat platform that pulls together a lot of financial data and charting tools into one spot. It’s great because you don’t have to jump between a bunch of different websites or apps to get your research done. The interface is clean and easy to get around, which is always a plus when you’re trying to make sense of markets.
What really makes Koyfin stand out is its ability to handle different kinds of data. You can look at stocks, ETFs, currencies, futures, and even big-picture economic stuff. It’s especially good if you like to see how different assets relate to each other or if you want to dig into company fundamentals alongside technical charts. They’ve got over 500 different metrics you can chart, and the historical data goes back a long way.
Here’s a quick look at what you can do:
- Multi-asset charting: Compare stocks, ETFs, or even currencies on the same chart to see how they perform against each other.
- Fundamental data: Chart things like revenue, profit margins, and valuation ratios directly alongside price action.
- Macroeconomic data: Keep an eye on interest rates, inflation, and other economic indicators that might affect your investments.
- ETF valuations: Get data on things like P/E ratios and yields for US-listed ETFs.
They also let you save your chart setups as templates, which is handy if you like to analyze things in a consistent way. Just set it up once, save it, and then you can quickly apply it to other stocks or ETFs.
While the free version is quite capable, especially for basic charting and market monitoring, some of the more advanced features, like intraday charts for certain assets or deeper ETF data, are locked behind their paid plans. Still, for a free tool, it offers a surprising amount of depth for both technical and fundamental analysis.
Koyfin has been recognized for its tools, even winning some awards for financial analytics and portfolio management. It seems like a solid choice for investors and advisors who want a modern platform that combines charting with a good chunk of research capabilities without costing an arm and a leg.
Wrapping It Up
So, that’s our look at the top free charting software for 2026. Finding the right tool can really make a difference when you’re trying to figure out what the market’s doing. We looked at a bunch of options, focusing on what you get for free – things like how easy they are to use, the tools they give you, and if you can tweak them to your liking. Remember, even though these are free, they pack a punch and can seriously help with your analysis. If you’re just starting out or don’t want to spend money, these five are solid choices. And hey, if you ever need more, many online brokers have their own charting tools built-in, often for free too. But for standalone charting power, these picks are hard to beat.
Frequently Asked Questions
What’s the best free charting tool out there?
For general use, ProRealTime’s free web version is fantastic. It offers unlimited indicators and multi-chart views without any annoying ads or requests to upgrade. TradingView and Yahoo Finance are also good choices, but they tend to put more limits on what you can do for free.
Can I use TradingView without paying?
Yes, you can use TradingView for free, but it has some limits. You get one chart per tab and can only use two indicators at a time. You’ll also see prompts to upgrade often. If you want more features like multiple charts or more indicators, you’ll need to pay, starting around $15 a month. However, platforms like ProRealTime offer many of these features for free.
Which free charting sites let you use the most indicators?
ProRealTime Web is the winner here, letting you use as many indicators as you want on its free plan. TradingView limits free users to just two indicators per chart, and StockCharts allows three. If you like using lots of technical tools, this difference really matters.
Do I really need to pay for charting software?
Not at all! All the top picks on this list have a free version that’s quite useful. ProRealTime Web is especially good because its free plan includes features that others charge for, like unlimited indicators and multiple chart layouts, all without ads. Other free plans might give you fewer indicators or fewer options for arranging your charts.
Where can I find free stock charts?
You can find great free stock charts on websites like TradingView, StockCharts.com, Finviz, Stock Rover, and Yahoo Finance. Many online stock brokers also offer free charting tools as part of their trading platforms, even if you don’t have much money in your account.
Are free charting tools good enough for serious analysis?
For many people, yes! Free tools from platforms like ProRealTime and TradingView offer powerful features that are great for spotting trends and making trading decisions. While paid versions offer even more advanced options, the free tiers are often robust enough for most casual investors and even some active traders.