
In the third part of our guide to forex trading with candlestick charts, we’ll be looking at what candlesticks can and can’t tell you about the price action over the period they cover. We’ll also be introducing a couple of standard positions that are often used to predict reversals – the star position, and the harami position.
Six Types of Candlestick – and What They Tell You
Essentially, what a candlestick shows is the battle between buyers (Bulls) and sellers (Bears) over a specified time period. There are basically six ways in which a candlestick can represent this battle:
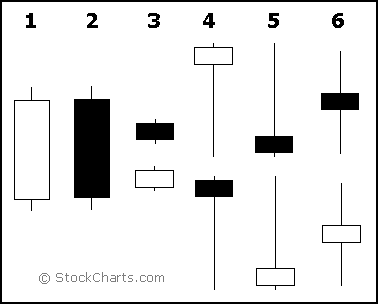
- Long hollow candlesticks show that buyers were dominant for most of the session.
- Long filled candlesticks show that sellers were dominant for most of the session.
- Small candlesticks show that neither buyers nor sellers dominated, and that the price ended up around the same point by the end of the session.
- A long lower shadow shows that sellers were dominant in the early part of the session, but then buyers made a comeback before the end of the session.
- A long upper shadow shows that buyers were dominant at the start of the session, but the sellers re-entered the market towards the end to even things out.
- Long upper and lower shadows show that both buyers and sellers had periods of dominance throughout the session, but neither emerged triumphant, resulting in a stalemate.
What Information is Missing From a Candlestick?
Although candlesticks can show you the relationship between the open and the close, they do not tell you much about the sequence of events in between. While the high and the low are obvious, neither candlesticks nor bar charts can tell you which came first.
In the case of a long hollow candlestick, the most obvious conclusion is that prices increased for most of the session. However, the session could have been more volatile than you might assume from looking at the candlestick. To illustrate this point, the image below shows two high/low sequences that would produce the same candlestick.
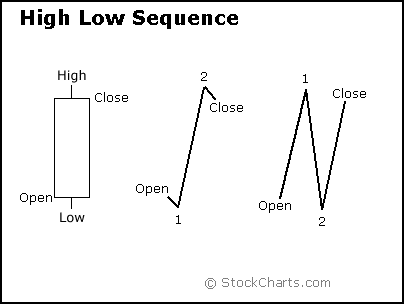
The first high/low sequence consists of two small moves followed by one big move, while the second shows three sharp moves. While the first sequence shows strong, sustained pressure from buyers, indicating bullishness, the second shows more volatility and selling pressure. In fact, there are hundreds of potential waveforms that could produce the same candlestick. So while candlesticks provide valuable information about the relative positions of the open, high, low, and close, the trading activity that forms a particular candlestick is in fact highly variable.
The Need to Establish Prior Trend
In order for a pattern of candlesticks to count as a reversal, there needs to be a prior trend to reverse. A bullish reversal needs a prior downtrend, and a bearish reversal needs a prior uptrend. The trend can be recognised by using tools such as peak/trough analysis, trendlines, and moving averages. For example, a downtrend might exist if the instrument was trading below a specific moving average, its previous reaction high, or its down trend line. Although the time frame is up to your individual needs and preferences, the short-term nature of candlesticks means that a time frame of between 1-4 weeks works best.
Candlestick Positioning
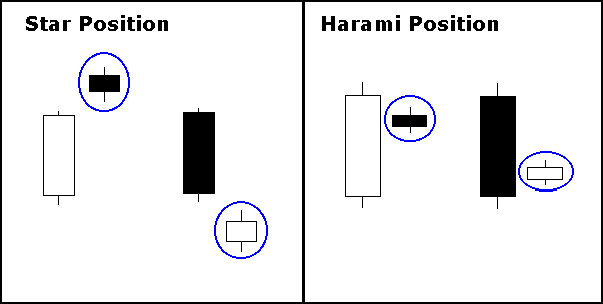
Star Position
If a candlestick gaps away from the previous candlestick, it is said to be in star position. Usually, but not always, the first candlestick has a large real body, and the second one (in star position) has a small real body. The star position candlestick gaps up or down, depending on the position of the previous candlestick, and seems to have nothing to do with the previous price action. The two candlesticks can be any combination of filled and hollow, and the star position candlestick can be any formation that has a small real body, such as hammers, shooting stars, Doji, and spinning tops.
Harami Position
Candlesticks that form within the range of the real body of the previous candlestick are said to be in the Harami (Japanese for pregnant) position. Usually, the first candlestick has a large real body, and the second one (in Harami position) has a smaller real body than the first. Although the shadows of the second candlestick do not have to be within the range of the first, it is preferable if they are. As with the star position, any formation with a small body, such as spinning tops or Doji, can form in the Harami position.
In the next and final part of our series on candlestick charting, we shall be looking at reversal patterns, and also the practice of blending candlesticks. Stay tuned!
Other Articles in This Series:
Guide to Forex Trading with Candlestick Charts Part 1
Guide to Forex Trading with Candlestick Charts Part 2: Doji
Tradersdna is a leading digital and social media platform for traders and investors. Tradersdna offers premiere resources for trading and investing education, digital resources for personal finance, market analysis and free trading guides. More about TradersDNA Features: What Does It Take to Become an Aggressive Trader? | Everything You Need to Know About White Label Trading Software | Advantages of Automated Forex Trading


