So, you’re looking to get a handle on TradingView, huh? It’s a pretty popular tool for anyone who trades stocks, crypto, or forex. Think of this as your go-to guide, a tradingview tutorial pdf that breaks down how to use this platform without making your head spin. We’ll cover everything from signing up and getting familiar with the charts to using some of the fancier tools and making sure you don’t lose your shirt. It’s all about making trading a bit less confusing.
Key Takeaways
- TradingView is a solid platform that brings together real-time data, charting tools, and a community of traders, making it useful for beginners and experienced folks alike.
- You can make the platform your own by changing chart layouts, themes, and saving your preferred settings, which really helps when you’re analyzing markets.
- Using a mix of analysis tools, like drawing tools and indicators together, gives you a better picture of market movements than relying on just one thing.
- Practicing trades with paper trading lets you test out strategies and get a feel for the market without risking any actual money.
- Managing your money carefully, like setting stop-losses and not risking too much on one trade, is just as important as knowing how to read a chart.
Understanding TradingView For Your Trading Journey
So, you’re looking to get a handle on TradingView for your trading adventures? That’s a smart move. Think of TradingView as your digital trading desk, packed with tools that can really help you see what’s going on in the markets. It’s not just about looking at prices; it’s about understanding the story those prices are telling.
What TradingView Offers Traders
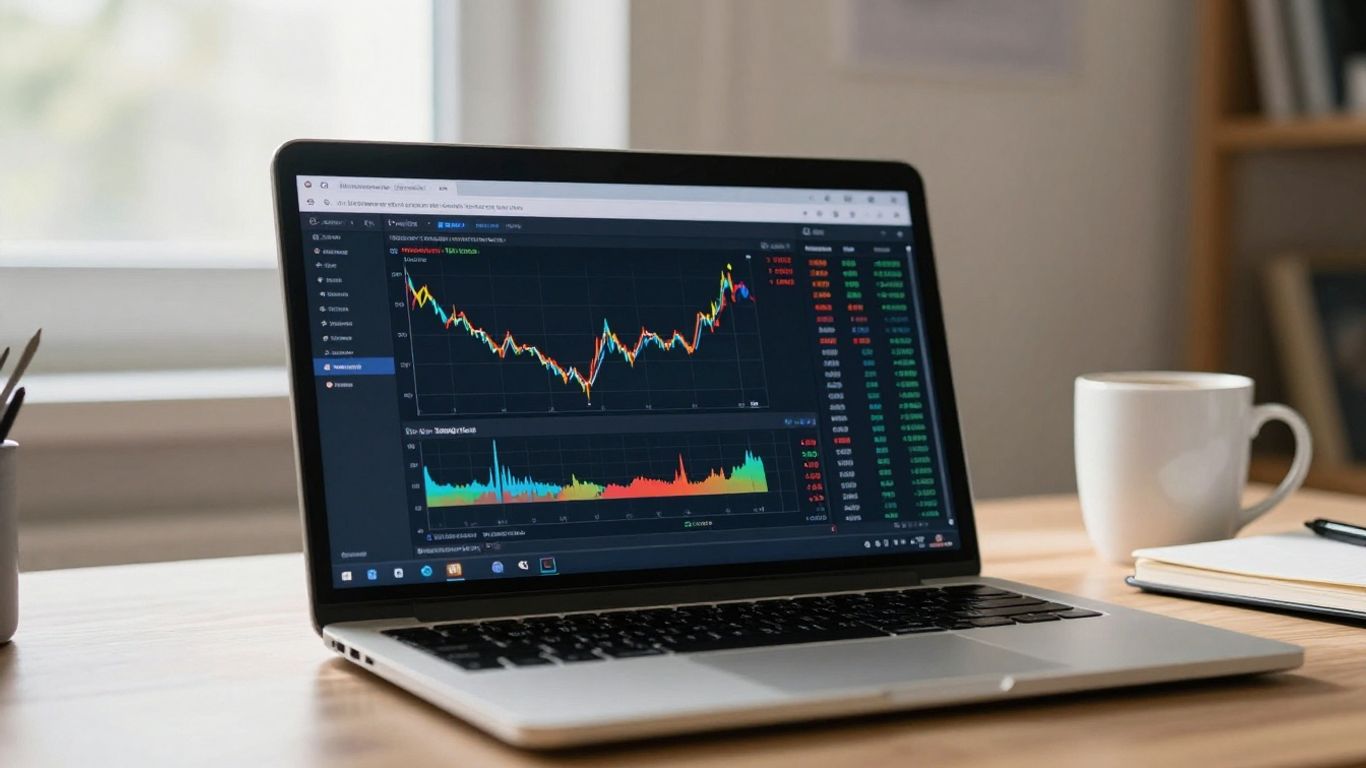
TradingView is basically a super-powered charting platform that you can use right in your web browser. It pulls in real-time data for stocks, crypto, forex, and more, so you’re always looking at what’s happening now. It’s got:
- Interactive Charts: You can switch between different chart types like candlesticks, bars, or lines in a flash. Plus, you can zoom in and out to see the big picture or the tiny details.
- Analysis Tools Galore: Need to draw trend lines, find support and resistance levels, or use Fibonacci tools? They’re all right there, ready to be used.
- A Community Feel: One of the neatest parts is the social aspect. You can see what other traders are sharing, check out their ideas, and even learn from their charts. It’s like having a bunch of trading buddies online.
- Custom Scripts: If you’re feeling adventurous, you can even write your own indicators or strategies using their Pine Script language.
Why TradingView Is Essential for Success
Let’s be honest, trading without good tools is like trying to build a house with just your hands. TradingView can seriously change how you approach the markets. Having up-to-the-minute data means you can make quicker, more informed decisions. Instead of digging through spreadsheets, you get a clear visual of price action, trends, and potential turning points. It cuts down on the guesswork and helps you focus on what actually matters.
TradingView isn’t just a charting tool; it’s a whole environment designed to help you see the markets more clearly. It brings together data, analysis tools, and a community of like-minded people, all in one accessible place.
Key Platform Features for Market Analysis
When you first log in, it might seem like a lot, but a few features really stand out for analyzing markets:
- Real-Time Data Feeds: Access to live prices across many different markets. This is non-negotiable for making timely trades.
- Drawing Tools: Simple lines, trend channels, Fibonacci retracements, and more. These help you mark up charts and spot patterns.
- Technical Indicators: Tools like Moving Averages, MACD, RSI, and Volume are built-in. They help you measure market momentum, volatility, and trends.
- Alerts: You can set up notifications for when prices hit certain levels or when specific conditions are met on your charts. This means you don’t have to stare at the screen all day.
- Paper Trading: This is a simulator that lets you practice trading with fake money. It’s a fantastic way to test strategies without risking any real cash.
Getting Started with Your TradingView Account
Alright, let’s get you set up on TradingView. It’s pretty straightforward, honestly. You’ll want to head over to the TradingView website to begin. The first thing you’ll need to do is create an account. This is your gateway to all the charting and analysis tools.
Step-by-Step Account Registration
Creating an account is simple. You can sign up using your email address, or if you prefer, you can link it to your Google or Facebook account. It usually takes just a couple of minutes.
- Visit the TradingView website.
- Click the "Get Started" or "Sign Up" button. You’ll find this prominently displayed on the homepage.
- Choose your registration method (email, Google, Facebook, etc.).
- Follow the on-screen prompts to complete the process. This might involve verifying your email address.
Once you’re registered, you’ll have access to the platform. It’s a good idea to take a moment to explore after you sign up.
Choosing the Right TradingView Plan
TradingView offers a few different plans, and picking the right one depends on what you need. They have a free version, which is quite capable, and then paid tiers like Essential and Premium.
- Free Plan: This is a great starting point. It gives you access to many charts, basic indicators, and alerts. It’s perfect for learning the ropes and getting comfortable with the platform without any cost.
- Paid Plans (Essential, Premium): If you find yourself needing more indicators on a single chart, want an ad-free experience, or require advanced features like more alerts or custom scripts, upgrading makes sense. Many traders start free and upgrade later as their needs grow.
It’s often best to start with the free plan to see if TradingView fits your trading style before committing to a paid subscription. You can always upgrade later if you decide you need more.
Customizing Your User Profile and Settings
After you’ve got your account set up, take a few minutes to tweak your profile and settings. This makes the platform feel more like your own and can help streamline your workflow. You can adjust things like:
- Time Zone: Make sure this matches your local time or the market you’re primarily watching.
- Date Format: Set this to what you’re most comfortable reading.
- Theme: Choose between a light or dark theme for the interface. Many traders prefer dark themes to reduce eye strain, especially during long sessions.
- Notifications: Configure how and where you want to receive alerts.
Getting these basics sorted now will save you time down the line and make your trading experience smoother. You can always revisit these settings later if needed. Explore TradingView features to see what else is available.
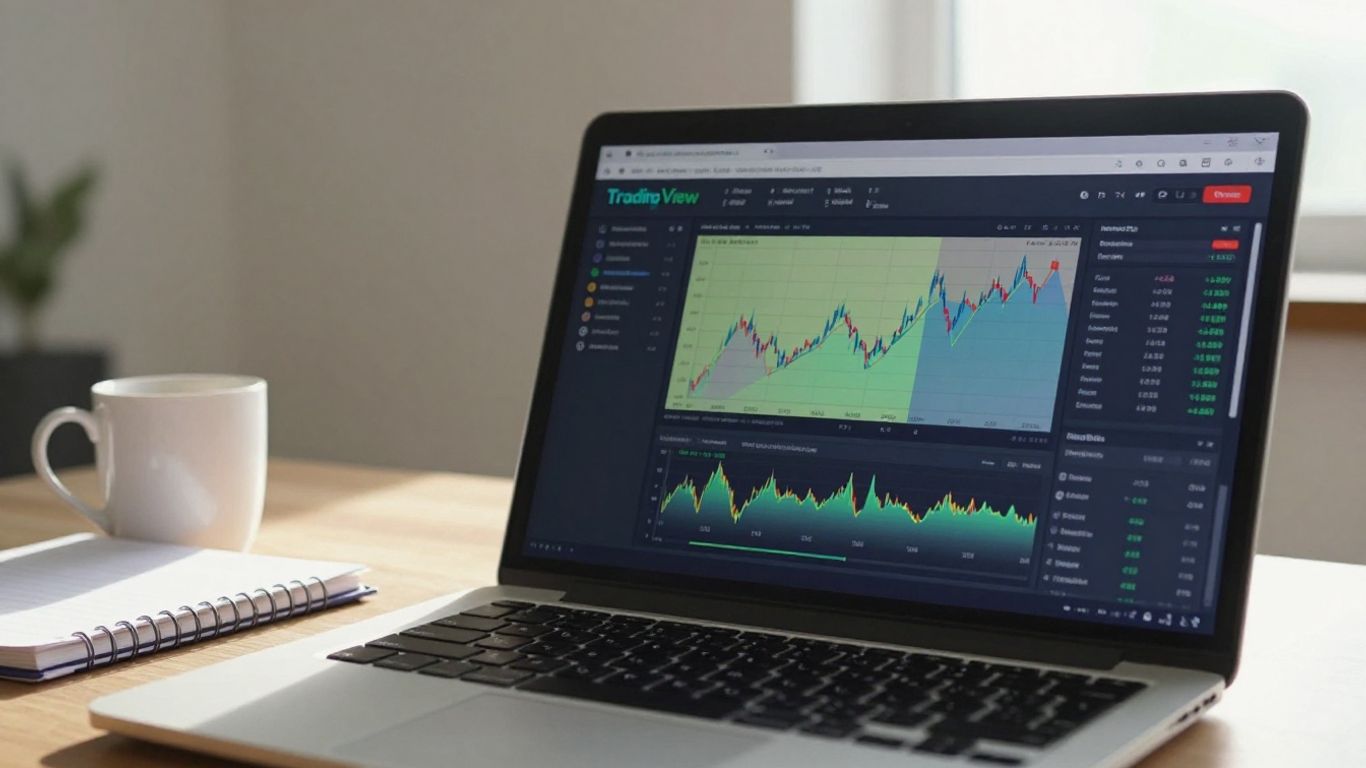
Navigating and Customizing TradingView Charts
Alright, so you’ve got your account set up and you’re ready to actually look at some charts. This is where the real work begins, but honestly, it’s also the fun part. TradingView has a lot going on, but once you get the hang of moving around and making it look how you want, it makes trading so much easier.
Understanding the TradingView Interface
When you first load up a chart, it can look a bit busy. You’ve got the main chart area, which is your big canvas. Then there’s a bar at the top where you can pick what you’re looking at – stocks, crypto, forex, you name it. On the sides, you’ll find your watchlists, news feeds, and other tools. Don’t feel like you need to know everything at once. Just start clicking around. The top bar is where you’ll change the symbol you’re viewing, the timeframe (like 1 minute, 1 hour, or daily), and the chart type.
Here are the main parts to get familiar with:
- Chart Area: This is the biggest part, where the price action is displayed. It’s your main workspace.
- Top Bar: Use this to switch between different markets, change timeframes, and select chart types.
- Left Panel: Often where you’ll find drawing tools and indicators.
- Right Panel: Usually shows your watchlists, news, and alerts.
- Bottom Panel: Can display order entry, your trades, and other account details.
Personalizing Chart Layouts and Themes
This is where you make the chart your own. Nobody likes staring at a screen that hurts their eyes, right? TradingView lets you change a bunch of things. You can pick a light theme or a dark theme. I usually go with dark mode myself; it feels easier on the eyes, especially if you’re trading late at night or early in the morning.
Beyond just light or dark, you can tweak the colors of the candles, the background, and the grid lines. Right-click anywhere on the chart and look for ‘Settings’. You can spend a good chunk of time here playing with colors until it feels just right. It might seem like a small thing, but having a chart that’s easy on your eyes can make a big difference in how long you can focus.
Saving Your Preferred Chart Settings
Once you’ve spent time setting up your chart just the way you like it – maybe you’ve picked your favorite colors, added a few indicators, and set a specific timeframe – you’ll want to save it. TradingView lets you save these setups as templates. This means that the next time you log in, you can just load up your saved layout instead of having to set everything up again from scratch. It saves a ton of time and hassle.
Think of it like this:
- Set up your chart exactly how you want it.
- Find the option to save the chart layout (usually near the chart type or timeframe selectors).
- Give your layout a name (e.g., "My Stock Setup" or "Crypto Watch").
- Save it.
Now, whenever you want that specific view, just go to your saved layouts and select it. It’s a simple feature, but it really helps keep your trading process organized and efficient.
Mastering Essential Charting and Analysis Tools
Alright, let’s get into the nitty-gritty of actually using TradingView to figure out what the market might do next. It’s not just about looking at lines; it’s about understanding what those lines, patterns, and numbers are telling you. These tools are your eyes and ears in the market.
Utilizing Drawing Tools for Technical Analysis
When you first start drawing on charts, it might feel a bit like doodling. But these aren’t just random scribbles; they help you visualize trends and important price levels. Think of them as your personal annotations on the market’s story.
- Trend Lines: These are pretty straightforward. For an uptrend, you connect a couple of significant lows. For a downtrend, you connect a couple of highs. They show the general direction price is moving. It takes a little practice to get them just right, making sure they touch as many price points as possible without cutting through the price action.
- Trend Channels: Once you have a trend line, you can often draw a parallel line to it. This creates a channel where price tends to move between. The upper line can act as resistance, and the lower line as support. It gives you a clearer picture of the price range.
- Chart Patterns: Tools like trend lines and rectangles can help you outline common patterns such as head and shoulders, double tops, or triangles. These patterns can sometimes give clues about where the price might go next. Don’t worry if they aren’t perfectly formed; markets are rarely textbook perfect.
Remember, drawing tools aren’t crystal balls. They are aids to help you interpret price action based on historical behavior. Use them to identify potential areas of interest, not as definitive predictions.
Exploring Key TradingView Indicators
Indicators are mathematical calculations based on price and volume. They can give you extra information, but it’s important not to get overwhelmed by them. TradingView has a huge library, so let’s look at a few common ones.
- Moving Averages (MA): These smooth out price data to show the average price over a specific period. A simple moving average (SMA) or an exponential moving average (EMA) can help identify trends and potential support or resistance levels. Many traders watch how shorter-term MAs cross over longer-term MAs.
- Relative Strength Index (RSI): This is a momentum oscillator that measures the speed and change of price movements. It oscillates between 0 and 100 and is often used to identify overbought or oversold conditions. A reading above 70 typically suggests overbought, while below 30 suggests oversold.
- MACD (Moving Average Convergence Divergence): This indicator shows the relationship between two moving averages of prices. It’s used to spot momentum, trend direction, and trend strength. It consists of a MACD line, a signal line, and a histogram.
Combining Indicators for Deeper Insights
Using just one indicator can sometimes be misleading. The real power comes when you combine different types of indicators to get a more complete picture. For example, you might use a trend-following indicator like a moving average along with a momentum indicator like the RSI.
- Confirmation: If a moving average suggests an uptrend, and the RSI is showing positive momentum (not in overbought territory), that’s a stronger signal than either indicator alone.
- Divergence: Sometimes, price might be making new highs, but an indicator like the RSI is making lower highs. This is called divergence and can signal a potential reversal.
- Avoid Over-Complication: While combining indicators is good, using too many can lead to conflicting signals and analysis paralysis. Stick to a few that you understand well and that work together logically. You can save your favorite indicators for quick access. Learning to use these tools effectively is a big step in your trading journey, and resources like this TradingView tutorial can help you get there.
Advanced Trading Strategies on TradingView
Once you’ve got the hang of the basics, it’s time to look at some of the more advanced ways you can use TradingView to your advantage. This isn’t just about looking at charts anymore; it’s about putting together a plan and testing it out.
Implementing Multi-Time Frame Analysis
This is a really useful technique. The basic idea is to look at the same financial asset on different time scales. For instance, you might check a daily chart to see the general direction the price is moving, and then switch to a 15-minute chart to pinpoint a good entry or exit spot. TradingView makes this easy by letting you set up multiple charts side-by-side. You can have a big picture view and a close-up view all at once. This helps confirm trends and can stop you from jumping into trades that look good on a short time frame but are actually going against the bigger trend.
Leveraging TradingView Screeners for Opportunities
Manually checking hundreds of stocks or cryptocurrencies to find trading ideas would take forever. That’s where screeners come in. TradingView has built-in screeners for stocks, forex, and crypto. You can set specific rules, like filtering for stocks with a certain price range, trading volume, or even specific indicator readings. For example, you could set up a screener to find stocks where the Relative Strength Index (RSI) is below 30, suggesting they might be oversold. It’s a great way to quickly narrow down your options to assets that fit your trading plan.
Practicing Strategies with Paper Trading
This is probably one of the most important features for anyone serious about trading. Paper trading, or simulated trading, lets you practice your strategies with fake money. You get real-time market data, but you’re not risking any actual cash. It’s perfect for testing out a new strategy you’ve developed or for getting comfortable with TradingView’s order execution without the fear of losing money. You can learn how to place different types of orders, set stop-losses, and take profits, all in a risk-free environment. It builds confidence and helps you refine your approach before you start trading with your own capital.
Testing your trading ideas in a simulated environment before committing real money is a smart move. It helps you understand how your strategy performs under different market conditions and identify potential flaws without financial consequences. This practice is key to developing a disciplined trading approach.
Setting Up Alerts and Managing Risk
Okay, so you’ve got your charts all set up, your indicators are looking good, and you’re ready to trade. But what happens when you can’t stare at the screen all day? That’s where alerts come in. They’re like your personal market assistant, letting you know when something important is happening.
Configuring Price Alerts to Maximize Opportunities
TradingView has a really neat alert system. You can set up notifications for all sorts of things. The most basic is a price alert. You know, like when the price of a stock or crypto crosses a certain level you’ve been watching. To set one up, you just click the little bell icon, usually found in the top right corner of your chart. Then you pick your condition – maybe "Price Greater Than" or "Price Less Than" – and type in the price. You can also choose if you want the alert to fire just once or keep repeating. Plus, you can get these alerts as pop-ups, emails, or even push notifications on your phone. This way, you don’t have to be glued to your monitor to catch a move. It’s super helpful for those times you need to step away.
Effective Risk Management Techniques
Now, alerts are great, but they’re only part of the picture. You also need to think about protecting your money. This is where risk management comes in. It’s not the most exciting topic, I know, but it’s really important if you want to stick around in trading for a while. A few key things to remember:
- Limit your losses: Try not to risk more than 1-2% of your total trading capital on any single trade. Seriously, this is a big one.
- Use stop-losses: These are orders that automatically close your position if the price moves against you by a certain amount. You can set them based on price levels or something called ATR (Average True Range).
- Keep a good risk-reward ratio: Aim for trades where your potential profit is at least twice or three times your potential loss. This means one good trade can cover a couple of smaller losses.
- Journal your trades: Write down what you did, why you did it, and how it turned out. It helps you learn from your mistakes and successes.
Protecting your capital should always be your number one priority. Without capital, you can’t trade. It’s that simple.
The Importance of Trading Psychology
Finally, let’s talk about your head. Trading isn’t just about charts and indicators; it’s also a lot about how you handle your emotions. Fear, greed, impatience – these can all mess with your trading decisions big time. Sticking to your plan, even when things get a bit wild, is key. Remember that technical analysis is a tool, but your mindset is what ultimately guides your actions. Being aware of your own psychological triggers and working on them is just as vital as mastering any charting technique. It takes practice, but it’s worth it for more consistent results. You can set alerts for indicator conditions too, like when the RSI goes above 70, which might signal an asset is overbought. This adds another layer to your trading plan. Remember, free accounts have a limit on active alerts, so consider upgrading if you plan on using many. This is a great way to stay informed without constant monitoring. TradingView alerts can be set for price levels, indicator values, or even when price interacts with drawing tools like trendlines.
Wrapping Up and What’s Next
So, we’ve gone through a lot in this guide, from getting your TradingView account set up to using some of the more advanced tools. It might seem like a lot at first, but remember, you don’t have to master everything overnight. The best way to really get a handle on TradingView is to just jump in and start using it. Play around with the charts, try out different indicators, and don’t be afraid to make mistakes – that’s how you learn. Keep practicing, keep exploring, and you’ll find your rhythm. TradingView is a powerful tool, and with a little effort, you’ll be charting like a pro in no time.
Frequently Asked Questions
What exactly is TradingView and why should I use it for trading?
Think of TradingView as your all-in-one trading command center. It’s a super popular online platform where you can see live prices of stocks, currencies, and cryptocurrencies on easy-to-understand charts. It also gives you tons of tools to help you figure out when to buy or sell, and you can even chat with other traders. It’s great for beginners because it’s user-friendly, but it’s also powerful enough for experienced traders.
How do I start using TradingView?
Getting started is a breeze! Just go to the TradingView website and click the ‘Sign Up’ button. You can create an account using your email, or link it with your Google or Facebook account. It’s free to sign up, and you can start exploring the platform right away. You’ll want to pick a plan that fits your needs, but the free version is fantastic for learning.
Can I try out trading strategies on TradingView without risking real money?
Absolutely! TradingView offers something called ‘paper trading.’ It’s like a practice mode where you get virtual money to test out your trading ideas. This is a brilliant way to get a feel for how trades work, practice your strategies, and build confidence without worrying about losing actual cash.
What are some of the most useful tools on TradingView for beginners?
For starters, get familiar with the drawing tools – like trend lines and support/resistance levels – to mark important price points on your charts. Also, learn about basic indicators like the Moving Average and RSI; they help show you if a price is going up or down and if it’s a good time to buy or sell. Don’t try to use too many at once; start simple!
How can I make sure I don’t miss important price movements on TradingView?
TradingView lets you set up alerts. Imagine you want to know the moment a stock hits a certain price. You can set an alert for that, and TradingView will notify you. This way, you won’t have to stare at the charts all day, and you can act quickly when opportunities arise.
Is TradingView good for trading different types of markets, like stocks and crypto?
Yes, TradingView is incredibly versatile! It covers a vast range of markets, including stocks from all over the world, forex (currency trading), cryptocurrencies, futures, and more. No matter what you’re interested in trading, TradingView likely has the data and tools you need to analyze it.