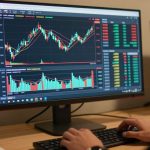
If you’re looking to boost your trading game, the TradingView buy sell indicator could be just what you need. This tool helps traders identify the best times to enter and exit trades, making it easier to maximize profits. In this article, we’ll break down how to set it up, interpret its signals, and integrate it into your trading strategy. Let’s get started!
Key Takeaways
- The TradingView buy sell indicator provides clear buy and sell signals using visual cues on the chart.
- Setting it up is straightforward, and you can customize it to fit your trading style.
- Understanding how to interpret the signals is crucial for making informed trading decisions.
- Combining this indicator with other tools can enhance your trading strategy.
- Proper risk management techniques are essential to protect your capital while using the indicator.
Understanding The TradingView Buy Sell Indicator

What Is A Buy Sell Indicator?
Buy sell indicators are tools that traders use to help them decide when to buy or sell an asset. They analyze price data and generate signals, suggesting potential entry and exit points. These indicators don’t guarantee profits, but they can provide insights into market trends. Think of them as a second opinion, not a crystal ball. They often use things like moving averages, RSI, or MACD to figure out the best times to make a move.
How It Works In TradingView
TradingView makes it pretty easy to use these indicators. You just search for one, add it to your chart, and it overlays the buy and sell signals directly on the price action. The platform has a ton of built-in indicators, and you can even find custom ones created by other users. These indicators transform price data into visual signals. Here’s a quick rundown:
- Data Input: The indicator takes in price data (open, high, low, close) and sometimes volume.
- Calculation: It runs calculations based on its specific algorithm.
- Signal Generation: Based on the calculations, it generates buy or sell signals, often displayed as arrows or labels on the chart.
TradingView indicators are mathematical calculations that transform price data into visual signals. This helps traders analyze market fluctuations by using historical price data, providing insights into current conditions and projecting future scenarios. Focusing on objective data helps avoid emotional trading, resulting in more consistent and profitable trades.
Benefits Of Using This Indicator
Using a buy sell indicator on TradingView can offer several advantages, but it’s important to remember that no indicator is perfect. Here are some potential benefits:
- Visual Confirmation: The most obvious benefit is the clear visual representation of potential buy and sell opportunities. No more guessing!
- Time Savings: Instead of manually analyzing charts all day, the indicator does some of the work for you.
- Objective Signals: Indicators can help remove some of the emotion from trading decisions.
Here’s a simple table showing how different indicators can be combined:
| Indicator 1 | Indicator 2 | Potential Strategy |
|---|---|---|
| Moving Average | RSI | Buy when price crosses above MA and RSI is oversold. |
| MACD | Volume Analysis | Buy when MACD crosses up and volume is increasing. |
| Candlestick Patterns | Support/Resistance | Buy after a bullish candlestick at support. |
Setting Up The TradingView Buy Sell Indicator
Installation Steps
Okay, so you’re ready to get this indicator up and running. First, you’ll need a TradingView account. Assuming you’ve got that sorted, head over to the "Indicators" section. You can find this by clicking on the "Indicators" button at the top of your chart. From there, you have a couple of options. You can search for community scripts, or if you have a specific script in mind, you can add it directly using its name. Once you find the buy sell indicator, just click on it, and it’ll automatically be added to your chart. It’s pretty straightforward, but sometimes the search function can be a little finicky, so double-check the name if you’re having trouble finding it.
Customizing Indicator Settings
Once the indicator is on your chart, you’ll probably want to tweak the settings to fit your trading style. Most indicators come with adjustable parameters. To access these, hover over the indicator’s name at the top-left of your chart and click the "Settings" icon (it looks like a little gear). This will open a window where you can change things like the sensitivity of the signals, the colors used for buy and sell alerts, and even the specific conditions that trigger those signals. Experiment with different settings to see what works best for you. Don’t be afraid to play around – that’s the best way to learn what each setting does.
Integrating With Other Tools
This is where things get interesting. A buy sell indicator is useful on its own, but it becomes way more powerful when you combine it with other tools and indicators. Think about adding volume indicators like VWAP, or oscillators like RSI to confirm signals. You can also use price action analysis, like candlestick patterns, to get a better sense of what’s happening in the market. The key is to find tools that complement each other and give you a more complete picture. For example, if the buy sell indicator gives a buy signal, you might want to check if the RSI is also showing oversold conditions before you jump in.
Integrating your buy sell indicator with other tools can significantly improve your trading strategy. By combining different analysis methods, you can filter out false signals and increase the probability of successful trades. Remember to backtest your combined strategy to ensure it performs well under various market conditions.
Interpreting Buy And Sell Signals

Identifying Buy Signals
Okay, so you’ve got the TradingView buy sell indicator set up. Now what? The first thing you need to know is how to spot a buy signal. Generally, a buy signal suggests that the price of an asset is likely to increase, making it a good time to enter a long position. These signals are usually visually represented by an upward-pointing arrow or a "BUY" label on the chart.
Here’s what to look for:
- Arrow Color: Often, buy signals are indicated by green or blue arrows. The specific color can be customized in the indicator’s settings.
- Indicator Placement: The arrow typically appears below the candlestick, signaling a potential upward move.
- Confirmation: Don’t just jump in blindly! Look for other confirming indicators or chart patterns to support the buy signal. For example, check if the trend direction aligns with the buy signal.
Recognizing Sell Signals
Just as important as identifying buy signals is knowing when to recognize sell signals. A sell signal suggests that the price of an asset is likely to decrease, indicating a good time to exit a long position or enter a short position. These signals are usually represented by a downward-pointing arrow or a "SELL" label on the chart.
Here’s what to look for:
- Arrow Color: Sell signals are often indicated by red or orange arrows. Again, the color is customizable.
- Indicator Placement: The arrow typically appears above the candlestick, signaling a potential downward move.
- Confirmation: As with buy signals, confirm sell signals with other indicators or chart patterns. Is there a clear breakout moment? Is there an exhaustion area?
Understanding Signal Strength
Not all buy and sell signals are created equal. Some signals are stronger than others, and it’s important to gauge their strength before making a trade. Signal strength can be influenced by several factors:
- Confluence: The more indicators that confirm the signal, the stronger it is. For example, if the buy sell indicator, RSI, and MACD all give buy signals at the same time, that’s a pretty strong indication.
- Volume: High volume during a signal can indicate strong conviction behind the move. If you see a buy signal with a large increase in volume, it suggests that many traders are buying, which could drive the price higher.
- Timeframe: Signals on higher timeframes (e.g., daily or weekly charts) are generally more reliable than signals on lower timeframes (e.g., 5-minute or 15-minute charts).
It’s important to remember that no indicator is perfect, and false signals can occur. Always use risk management techniques, such as setting stop losses, to protect your capital. Don’t rely solely on the buy sell indicator; use it in conjunction with other forms of analysis to make informed trading decisions.
Enhancing Trading Strategies With The Indicator
Combining With Other Indicators
To really get the most out of a buy/sell indicator, don’t use it in isolation. Think of it as one piece of a larger puzzle. Combining it with other indicators can provide a more complete picture of market conditions and improve the accuracy of your trading decisions. For example, you could pair it with a Moving Average to confirm the overall trend, or with the Automated Buy/Sell Labels to pinpoint optimal entry and exit points.
- RSI (Relative Strength Index): Helps identify overbought or oversold conditions.
- MACD (Moving Average Convergence Divergence): Useful for spotting changes in momentum.
- Fibonacci Retracements: Can highlight potential support and resistance levels.
Using multiple indicators together helps filter out false signals and increases the probability of successful trades. It’s about finding the right combination that works for your trading style and the specific market you’re trading.
Using Volume Analysis
Volume analysis is another great way to confirm signals from your buy/sell indicator. High volume during a buy signal suggests strong buying pressure, making the signal more reliable. Conversely, low volume might indicate a weaker signal, suggesting you should be cautious. Here’s a simple way to think about it:
| Signal Type | Volume | Interpretation |
|---|---|---|
| Buy | High | Strong buying interest, signal more reliable |
| Buy | Low | Weaker signal, potential for a false breakout |
| Sell | High | Strong selling pressure, signal more reliable |
| Sell | Low | Weaker signal, potential for a false breakdown |
Incorporating Candlestick Patterns
Candlestick patterns can provide additional confirmation for buy and sell signals. For instance, if your indicator generates a buy signal and you also see a bullish engulfing pattern on the candlestick chart, that’s a strong indication that the price is likely to move higher. Some common candlestick patterns to look for include:
- Bullish Engulfing: Suggests a potential reversal to an uptrend.
- Hammer: Can indicate a bottom reversal.
- Shooting Star: Often signals a potential top reversal.
By combining candlestick patterns with your buy/sell indicator, you’re essentially layering multiple analysis techniques to increase the reliability of your trading signals. It’s all about finding confluence – when multiple indicators and patterns align, it strengthens the case for a particular trade.
Minimizing False Signals
Trading indicators, including buy sell indicators, aren’t perfect. They can generate false signals, leading to potential losses. It’s important to understand how to minimize these occurrences to improve your trading accuracy and profitability.
Understanding Liquidity Zones
Liquidity zones are areas on a price chart where a significant number of buy or sell orders are concentrated. These zones can act as magnets for price, and breakouts or breakdowns from these zones can sometimes trigger false signals. It’s important to identify these zones and be cautious when the indicator generates a signal near them. For example, a buy signal right below a major resistance level (a liquidity zone where many sell orders are likely placed) might be a false signal if the price fails to break through that resistance.
Adjusting Sensitivity Settings
Most buy sell indicators have adjustable settings that control their sensitivity. A more sensitive indicator will generate more signals, but it will also generate more false signals. A less sensitive indicator will generate fewer signals, but those signals will likely be more reliable. Finding the right balance is key.
Here’s a simple way to think about it:
| Sensitivity | Signal Frequency | Accuracy | Risk |
|---|---|---|---|
| High | High | Lower | Higher |
| Low | Low | Higher | Lower |
Adjusting the sensitivity settings is a balancing act. You want enough signals to capitalize on opportunities, but not so many that you’re constantly whipsawed by false alarms. Experiment with different settings on a demo account to find what works best for your trading style and the specific asset you’re trading.
Best Practices For Signal Confirmation
Don’t rely solely on the buy sell indicator. Confirm signals with other forms of analysis. Here are some best practices:
- Use multiple indicators: Combine the buy sell indicator with other indicators, such as the Relative Strength Index (RSI), MACD, or moving averages, to confirm signals.
- Analyze volume: Look for increasing volume on buy signals and decreasing volume on sell signals. This can help confirm the strength of the signal.
- Consider candlestick patterns: Certain candlestick patterns can provide additional confirmation of buy or sell signals. For example, a bullish engulfing pattern appearing at the same time as a buy signal can increase the likelihood of a successful trade.
By using these confirmation techniques, you can filter out many false signals and improve the overall accuracy of your trading strategy.
Testing And Optimizing Your Strategy
Backtesting The Indicator
Backtesting is how you see if your strategy actually works. It’s like a dress rehearsal before the big show. You’re using historical data to simulate trades and see how the indicator would have performed in the past. This helps you identify potential weaknesses and areas for improvement. There are several ways to backtest, including manual backtesting (going through charts bar by bar) and automated backtesting (using software to run simulations). Backtesting the indicator is a must before risking real money.
Analyzing Performance Metrics
Once you’ve backtested, it’s time to crunch the numbers. Key metrics to look at include:
- Win Rate: Percentage of winning trades.
- Profit Factor: Gross profit divided by gross loss. A profit factor above 1.0 is generally desirable.
- Maximum Drawdown: The largest peak-to-trough decline during the backtesting period. This shows the potential risk.
- Average Trade Length: How long trades typically last. This can help you optimize your trading schedule.
Here’s an example of how you might organize your backtesting results:
| Metric | Value |
|---|---|
| Win Rate | 60% |
| Profit Factor | 1.5 |
| Max Drawdown | 10% |
| Avg Trade Length | 2 days |
Making Adjustments Based On Results
Backtesting isn’t just about seeing if your strategy works; it’s about making it better. If your backtesting results aren’t great, don’t give up! Instead, consider these adjustments:
- Adjust Indicator Settings: Experiment with different settings on the TradingView buy sell indicator to see if you can improve its accuracy.
- Refine Entry/Exit Rules: Maybe you need to be more selective about when you enter or exit trades. Try adding additional filters or conditions.
- Change Timeframes: The indicator might work better on a different timeframe (e.g., switching from 15-minute charts to hourly charts).
It’s important to remember that past performance is not necessarily indicative of future results. Market conditions can change, so it’s crucial to continuously monitor and adjust your strategy as needed. Don’t be afraid to tweak things and see what works best for you. Also, consider candlestick patterns to confirm signals.
Risk Management Techniques
Trading isn’t just about finding the perfect buy and sell signals; it’s also about protecting your capital. Good risk management can be the difference between long-term success and blowing your account. Let’s explore some key techniques.
Setting Stop Losses
Stop losses are your safety net. They automatically close your position if the price moves against you beyond a certain point. It’s like saying, "Okay, I was wrong about this trade, and I’m willing to lose this much, but no more." Where you place your stop loss depends on your strategy, the volatility of the asset, and your risk tolerance. A common approach is to use technical levels like support and resistance, or volatility measures like Average True Range (ATR) to determine appropriate stop-loss distances. You can even use percentage-based stop loss and take profit levels.
Determining Position Sizes
Position sizing is all about how much of your capital you allocate to a single trade. The goal is to risk a fixed percentage of your account on each trade, regardless of the asset’s price. A common rule is the 1% rule: never risk more than 1% of your trading capital on a single trade. So, if you have a $10,000 account, you wouldn’t risk more than $100 on any one trade. This helps to smooth out the inevitable losing streaks and prevents any single trade from wiping you out. There are even tools that help you calculate optimal position sizes.
Establishing Profit Targets
Knowing when to take profits is just as important as knowing when to cut losses. Profit targets define the price level at which you’ll automatically close your position to secure your gains. Setting realistic profit targets involves considering factors like market volatility, support and resistance levels, and your risk-reward ratio. A common strategy is to aim for a risk-reward ratio of at least 1:2, meaning you’re aiming to make twice as much as you’re risking. Some traders even set up to 5 customizable take-profit targets.
Risk management isn’t about eliminating risk entirely; it’s about controlling it. It’s about making sure that when you’re wrong (and you will be wrong sometimes), the damage is limited, and when you’re right, you can capture a decent profit. It’s a boring topic, but it’s what separates the pros from the amateurs.
Here’s a simple example of how risk management works in practice:
| Account Size | Risk per Trade (1%) | Stop Loss Distance | Position Size |
|---|---|---|---|
| $10,000 | $100 | $0.50 | 200 Shares |
| $5,000 | $50 | $0.25 | 200 Shares |
| $2,000 | $20 | $0.10 | 200 Shares |
Wrapping It Up
In conclusion, using the Ultimate TradingView Buy Sell Indicator can really help you sharpen your trading game. With its clear buy and sell signals, you can make better decisions on when to enter or exit trades. Plus, it cuts down on those annoying false signals by focusing on key trends and volume. Just remember, while this tool is super helpful, it’s still important to do your own research and analysis before jumping into any trades. So, give it a shot, keep an eye on your charts, and happy trading!
Frequently Asked Questions
What is a Buy Sell Indicator?
A Buy Sell Indicator helps traders decide when to buy or sell a stock or asset by showing clear signals on the chart.
How does the Buy Sell Indicator work in TradingView?
In TradingView, the indicator shows a green ‘BUY’ label below the price bar when it’s a good time to buy, and a red ‘SELL’ label above the bar when it’s a good time to sell.
What are the benefits of using this indicator?
Using this indicator can help you find the best entry and exit points for your trades, making it easier to make profits.
How do I set up the Buy Sell Indicator?
You can set up the indicator by adding it to your TradingView chart and adjusting the settings to fit your trading style.
How can I reduce false signals from the indicator?
You can minimize false signals by adjusting the sensitivity settings and confirming signals with other tools or indicators.
What should I do if my trading strategy isn’t working?
If your strategy isn’t working, consider backtesting it, analyzing your results, and making adjustments based on what you learn.