So, you want to get better at trading, right? Lots of people are talking about TradingView, and for good reason. It’s this really popular online tool that shows you live market charts. Think of it as your main window into what the markets are doing, right now. This guide is all about helping you use that trading chart live on TradingView. We’ll go through how to set it up, what tools are super helpful, and how to actually make trades. It’s not as complicated as it sounds, and by the end, you’ll feel way more confident using it.
Key Takeaways
- Get familiar with the TradingView platform layout and how to change your chart’s look.
- Learn to use built-in tools like technical indicators and set up alerts for market changes.
- Understand different chart types, like candlesticks, and how to customize them for your trading style.
- See how you can connect your brokerage account to TradingView to place trades directly.
- Discover advanced features like replaying past market data and testing your trading ideas.
Navigating Your Live Trading Chartview Interface
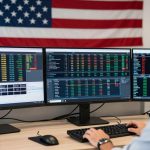
Getting around the TradingView platform might seem a bit much at first, but it’s pretty straightforward once you get the hang of it. Think of it as your main dashboard for watching the markets. You’ve got your charts, your watchlists, and all sorts of tools right there. The key is to make it work for you, not the other way around.
Understanding The TradingView Platform
When you first log in, you’ll see a lot going on. There’s the main chart area, which is where all the action happens. On the sides, you’ll usually find your watchlists (the stocks or assets you’re tracking) and a panel for order entry or news. Don’t feel like you need to use everything at once. Start by just getting familiar with where things are. You can add or remove panels, and even change the layout to suit your style. It’s all about creating a workspace that feels comfortable and efficient for your trading.
Customizing Your Trading Chart
This is where TradingView really shines. You can change almost anything about how your charts look. Want to see prices as candlesticks? Easy. Prefer a simple line chart? Done. You can also change the colors, add different timeframes, and even overlay multiple indicators. It’s really about personalizing your view so you can spot patterns and make decisions more easily. For example, you might want to see:
- Candlestick Charts: Great for showing the open, high, low, and close prices for a specific period.
- Bar Charts: Similar to candlesticks but often displayed as simple vertical lines with horizontal ticks.
- Line Charts: Useful for a quick overview of price movement over time, smoothing out the daily fluctuations.
Customizing your chart isn’t just about looks; it’s about making the data as clear as possible for your analysis. What works for one trader might not work for another, so experiment until you find what clicks.
Leveraging Built-In Trackers
TradingView comes with a bunch of helpful tools already built-in. You’ve got things like a stock screener to find potential trading opportunities based on specific criteria, and a news feed that pulls in relevant market updates. There’s also a way to track your performance, which is super important for seeing what’s working and what’s not. If you’re just starting out, trying out Paper Trading is a smart move. It lets you practice with fake money in real market conditions, so you can get a feel for the platform and test your strategies without any risk.
Essential TradingView Tools For Live Analysis
TradingView gives you a bunch of tools to really dig into the markets. It’s not just about looking at pretty charts; it’s about using what’s there to make smarter moves.
Utilizing Technical Indicators
Technical indicators are like your trading compass. They use past price and volume data to give you clues about where the market might go next. TradingView has a ton of them built-in, from simple moving averages to more complex ones like the MACD or RSI. You can add them right onto your chart.
- Moving Averages: Smooth out price action to show the trend direction.
- RSI (Relative Strength Index): Helps identify overbought or oversold conditions.
- MACD (Moving Average Convergence Divergence): Shows the relationship between two moving averages of prices.
It’s important to remember that no indicator is perfect. They work best when you use them together and understand what they’re actually telling you. Learning how to use TradingView to perform Technical Analysis on financial assets is a good place to start.
Setting Up Market Alerts
Waiting around for a specific price to hit can be a real drag. That’s where alerts come in handy. You can set up notifications for when a price crosses a certain level, or when an indicator gives a specific signal. This means you don’t have to stare at the screen all day. You can get an alert sent to your phone or email, letting you know it’s time to check the chart.
Setting up alerts means you can step away from your screen without missing opportunities. It’s about letting the platform do some of the watching for you.
Streamlining Analysis With Templates
If you find yourself adding the same set of indicators and drawing tools to every chart you look at, you’re wasting time. TradingView lets you save your chart setups as templates. So, the next time you open a new chart, you can just load your preferred template, and boom – everything is set up how you like it. This really speeds things up, especially if you follow a lot of different markets or assets.
Mastering Chart Types On TradingView
Choosing the right chart type on TradingView is a big deal for how you see the market. It’s not just about pretty pictures; it’s about how you interpret price action and make decisions. TradingView gives you a few main options, and each one shows you the same data, just in a different way.
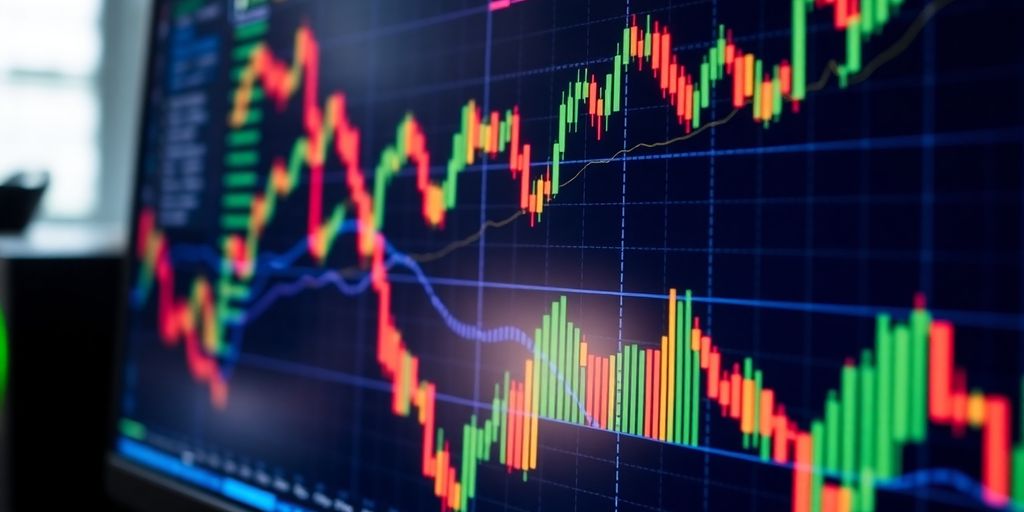
Candlestick Charts For Live Trading
Candlesticks are probably the most popular for a reason. They pack a lot of info into each period. You get the open, high, low, and close (OHLC) for that time frame. The body of the candle shows the open and close, and the wicks (or shadows) show the high and low. If the close is higher than the open, the candle is usually green or white, showing a bullish move. If the close is lower, it’s red or black, indicating a bearish move. These visual cues make it easy to quickly gauge market sentiment. Understanding candlestick patterns can give you an edge.
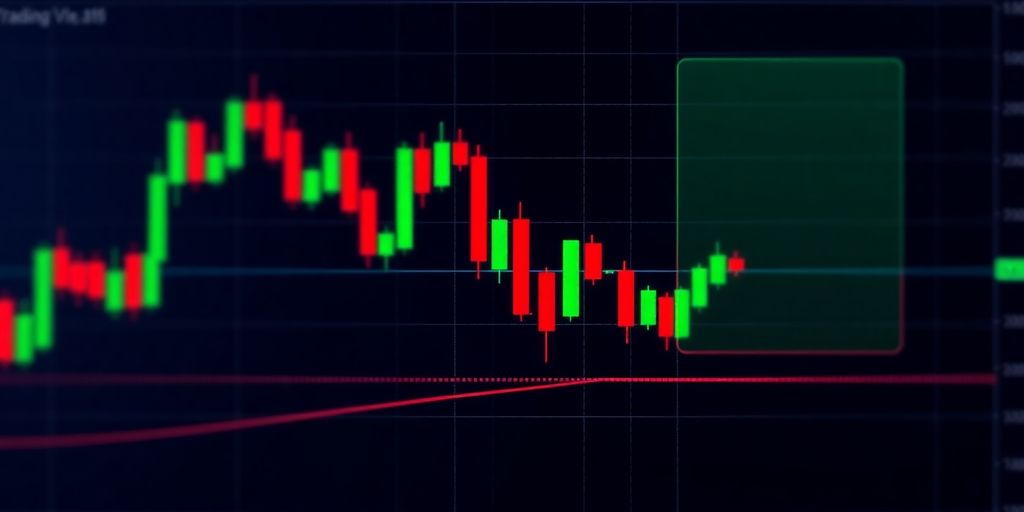
Bar Charts And Line Charts
Bar charts are similar to candlesticks, also showing OHLC for each period. Instead of a body, they use a horizontal line for the open and a tick on the other side for the close. The vertical line represents the high and low range. They can be a bit cleaner visually if you find candlesticks too busy. Line charts, on the other hand, are much simpler. They typically just plot the closing price over time, creating a smooth line. These are great for spotting longer-term trends or when you want a very uncluttered view of price movement. They’re less useful for short-term, detailed analysis but good for a big-picture look at market trends.
Customizing Chart Views
TradingView lets you really tweak your charts. You can change the colors of your candlesticks or bars, adjust the timeframes displayed, and even add different data series to the same chart. For example, you might want to see the volume bars below your price chart, or maybe overlay a moving average. Being able to set up your chart exactly how you like it helps you focus on what matters to you. It’s all about making the data work for your specific trading style. You can save these custom layouts as templates, so you don’t have to set them up every time you want to look at a particular asset. This saves a ton of time when you’re doing your daily technical analysis.
The way you visualize price data directly impacts your interpretation. Don’t just stick with the default; experiment to find what makes the most sense for your trading approach.
Integrating Live Trading With TradingView
TradingView isn’t just for looking at charts; you can actually trade right from the platform. It makes things way simpler when you’re trying to catch a market move. The key is connecting your brokerage account so everything is in one place.
Placing And Managing Trades
Once your broker is linked, you’ll see a trading panel, usually at the bottom of your screen. From here, you can open new orders, like buying or selling a currency pair. You can pick your order type – market orders execute immediately at the best available price, while limit orders let you set a specific price you want to trade at. You can also set stop-loss orders to limit potential losses and take-profit orders to lock in gains. Managing your open trades is just as easy; you can adjust your stop-loss or take-profit levels directly from the chart or the trading panel.
Connecting Your Brokerage Account
To start trading directly, you first need to link your brokerage account to TradingView. Look for the ‘Trading’ tab or a similar option in the platform’s interface. TradingView supports a good number of brokers, so you’ll likely find yours there. You’ll need to authorize TradingView to access your account, which usually involves logging into your broker’s portal through a secure pop-up. Make sure you’ve chosen a reliable broker; you can find top brokers with verified reviews to help you decide here.
Executing Trades Directly
With your account connected and your chart set up, executing trades becomes straightforward. Decide on the asset you want to trade, the amount, and the order type (market, limit, stop-loss, take-profit). Click ‘Buy’ or ‘Sell’ to place the order. You’ll see your open positions and pending orders in the trading panel. It’s a good idea to start with smaller trades to get comfortable with the process before committing larger amounts. This direct execution feature really cuts down on the time between spotting an opportunity and acting on it.
Advanced TradingView Capabilities
TradingView isn’t just about looking at charts; it’s about actively using them to get ahead. This section covers some of the more powerful features that can really change how you approach the market.
Replaying Market History
Ever wish you could go back and see how a specific event played out in real-time, or practice your analysis on past price action without the pressure of live trading? TradingView lets you do just that. You can rewind the chart to a specific point and then play it forward, bar by bar, or at a faster speed. This is a fantastic way to test your ideas or just get a feel for how different market conditions look. It’s like having a time machine for your trading education.
Building and Testing Strategies
This is where things get really interesting for those who like to get a bit more technical. TradingView has a built-in strategy tester. You can code your own trading rules using their Pine Script language, or use pre-built ones, and then run them against historical data. This tells you how your strategy would have performed in the past. You can tweak parameters, see the results, and get a much clearer picture of whether your idea has potential before risking real money. It’s a serious step up from just guessing.
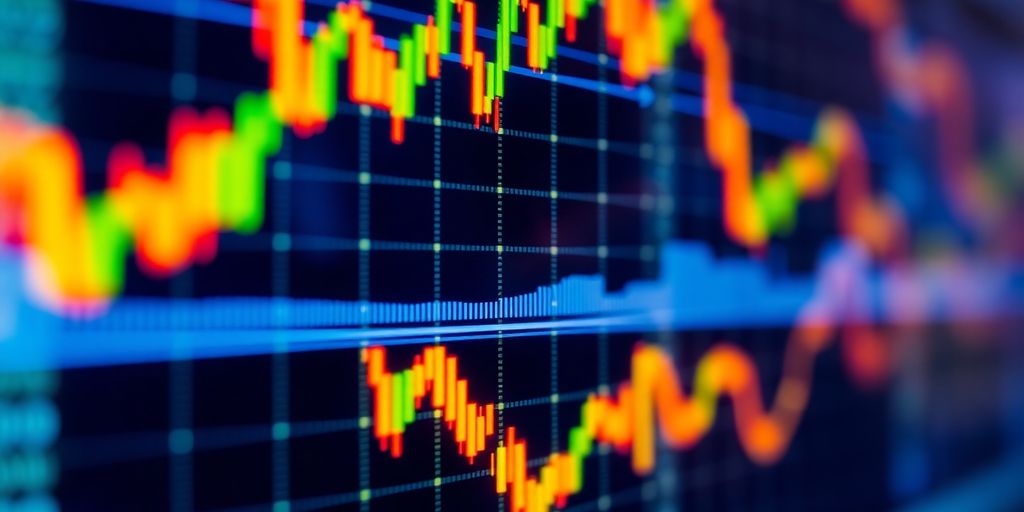
Spotting Trends With Visuals
Beyond the standard indicators, TradingView offers ways to make trends more obvious. Think about custom drawing tools that highlight support and resistance levels, or patterns like head and shoulders. You can also use features like the Smart Money Concepts indicator, which aims to visually represent institutional trading activity. By combining these visual aids with your analysis, you can often spot opportunities or potential reversals more easily than just looking at raw price data. It helps make sense of the noise.
Staying Informed With TradingView
Staying on top of market happenings is pretty important if you want to trade well. TradingView gives you a few ways to do this without having to jump between a bunch of different sites.
Accessing The News Feed
TradingView has a news feed built right in. You can see what’s going on in the markets, like major company announcements or economic shifts, without leaving your charts. It’s a good way to get a quick pulse check on what might be moving prices. This integrated news helps you connect real-time events to chart patterns.
Utilizing The Economic Calendar
This is super handy for seeing upcoming economic events that could shake things up. Think central bank meetings, inflation reports, or employment numbers. You can filter it by country or event type to focus on what matters for your trades. It’s like having a heads-up on potential market movers.
Currency Conversion Tools
Need to quickly figure out what one currency is worth in another? TradingView has a converter tool for that. It’s straightforward and gives you current exchange rates, which is useful if you’re trading pairs or just need to understand international market values. It’s a simple tool, but it saves you from opening another tab.
Keeping up with news and economic events can really help you understand why prices are moving the way they are. It’s not just about the charts; it’s about the bigger picture too. Using these tools together gives you a more complete view of the market.
Putting It All Together
So, we’ve gone through the basics of TradingView, from setting up your charts to using different tools for analysis. It’s a pretty powerful platform, and honestly, getting comfortable with it takes a bit of practice. But by now, you should have a good handle on how to customize your workspace and start making sense of the market data. Remember, the key is to keep using it, trying out different features, and seeing what works best for your own trading style. Don’t be afraid to experiment; that’s how you really learn. Good luck out there.
Frequently Asked Questions
What exactly is TradingView?
TradingView is a super helpful online tool that lets you look at charts for different markets like stocks and currencies. It’s great for figuring out how prices might move. Many traders use it because it has lots of cool features to help them.
Can I change the look of my charts on TradingView?
Yes, you can! TradingView lets you change how your charts look. You can pick different styles like candlesticks, bars, or lines, and even add colors or other details to make them easier for you to understand.
How do technical indicators help my trading on TradingView?
Absolutely! TradingView has tools called indicators that help you see patterns and trends in the market. Think of them like special glasses that highlight important information on the charts, helping you make smarter trading choices.
How can I get notified about market changes on TradingView?
You can set up alerts on TradingView to let you know when a price reaches a certain level or when something specific happens in the market. This way, you won’t miss out on important trading opportunities even if you’re not watching the charts all the time.
Can I trade directly through TradingView?
TradingView lets you connect your brokerage account. This means you can actually place and manage your trades right from the TradingView platform, making the whole process much smoother and quicker.
Can I practice trading with past market data on TradingView?
Yes, TradingView has a feature that lets you replay past market movements. This is like watching a recording of how prices behaved before. It’s a fantastic way to practice your trading skills and test out different ideas without risking real money.