
In the eleventh episode of the Traders DNA Academy’s Forex Trading Education video series, Global Capital Markets Solutions Managing Director Wayne Walker sheds some light on one of the most hotly-debated topics in the trading world: which is the best type of technical analysis chart to use?
In the video, which can be viewed above or on the IntelligentHQ video channel, I explain a little about how some of the simplest types of technical analysis charts work, and what their strengths are. Ultimately, your choice of technical analysis chart very much depends on what gets you the best and most useful results. There are lots of different ways that charts can be configured to display price data, but if you are new to technical analysis, it is best to start off with the ones that are easiest to understand. In my opinion, these are:
Moving Average (MA)
Moving Average is one of the most commonly-used technical analysis indicator, showing the average price over a set period. These are usually used to measure momentum and define possible areas of support and resistance. These help to make trends clearer by smoothing out fluctuations in volume and price, effectively filtering out the ‘noise’ so that you can get a better picture of the true movement.
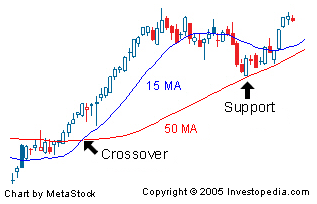
Source: Investopedia
Usually, upward momentum is indicated when a short-term average, such as a 15-day average, crosses above a longer-term average such as 50 days. When a short-term average crosses below a long-term average, it indicates downward momentum.
Relative Strength Index (RSI)
RSI charts are designed to show the current and historical strength of a financial instrument, such as currency pairs, based on the closing prices within a given time-frame. This type of chart is classed as a momentum oscillator, and measures the speed and magnitude of directional price movements. In short, they chart the momemntum of the instrument, which is the rate at which it is falling or rising in price. This is expressed as a ratio of higher closes to lower closes. Instruments have a higher RSI when they have had more positive movements than negative ones, and a lower RSI means that the instrument has had more negative movements than positive ones.
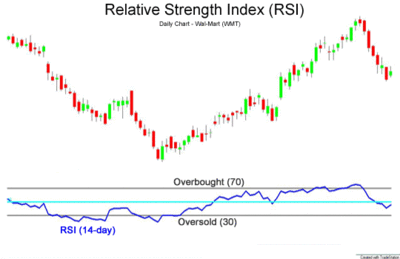
Source: Wikipedia
Typically, the RSI is used in conjunction with a 14 day time frame, although shorter or longer timeframes are sometimes used to provide different lengths of outlooks. It is measured on a scale of 0 to 100, with high and low levels being marked at 70 and 30 respectively. It is less common to see more extreme levels than this, such as 80-90 or 10-20, and when these occur it indicates that the momentum is very strong. with high and low levels marked at 70 and 30, respectively.
These are particularly useful for identifying when an instrument is being over-bought or over-sold, both of which indicate that the price momentum may be about to change direction. When an instrument is being over-bought, it means that the price is being pushed above its natural level by high demand among traders, and this is usually followed by a sell-off as traders try to lock in profits. When it is being over-sold, it means that the price is falling to a point where it becomes attractive to buyers again.
Bollinger Bands
Bollinger Bands are designed to measure volatility, providing a relative definition of high and low. Prices in the upper band are high, and prices in the lower band are low. This gives you an idea of where you are in the Buy/Sell Channel, and can provide a clearer picture of the likely future price direction of the instrument, especially when used as an overlay with a an RSI or Moving Average chart. When the bands are close together, it indicates a consolidation, which is often a sign that a breakout is imminent.
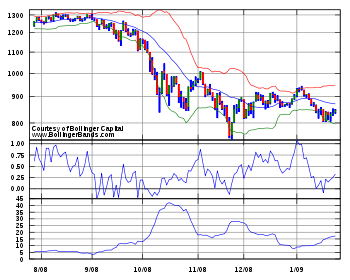
Source: Wikipedia
Each band consists of an N-period moving average (MA), an upper band at K times an N-period standard deviation above the moving average (MA + Kσ), and a a lower band at K times an N-period standard deviation below the moving average (MA − Kσ). In a typical Bollinger Band chart, N is set at 20 and K is set at 2. Although Moving Averages are most commonly employed, other types of averages (such as Exponential Moving Averages) are sometimes used.
The Traders DNA Academy
This video series has been brought to you by the Traders DNA Academy, an online educational resource for currency traders from the novice to the professional. The Academy provides a range of materials to help you become a better trader, such as:
- Forex MBA – An online course that takes you from the very basics of the forex markets up to advanced topics such as algorithm trading and technical analysis. Modules are assessed, and certification is awarded to those who have successfully passed the tests for each module.
- Video Tutorials – Sometimes, it’s better to have something explained verbally, especially if it’s a tricky concept to get your head around. Our video tutorials are designed to make seemingly difficult concepts easier to understand, and provide a complement to our written tutorials and diagrams.
- Resources for Traders – New technologies, such as social media, are changing the way traders do business. We provide practical resources to help you leverage these changes, including profiles of the most influential forex voices on social media and interviews with industry insiders.
- Platform Guides – If you want to be a successful trader, you need to know your trading platform inside out. To this end, we provide easy-to-follow user guides for someof the most popular trading front-ends such as Metatrader 4.
Previous articles in this series
Traders DNA Academy – Forex Trading Education by Wayne Walker Part 1
Traders DNA Academy – Forex Trading Education by Wayne Walker Part 2
Traders DNA Academy – Forex Trading Education by Wayne Walker Part 3
Traders DNA Academy – Forex Trading Education by Wayne Walker Part 4
Wayne Walker is a highly sought-after trading educator, having given talks and training sessions on the topics of trading and management in countries around the world. Originally from New York, he moved to Copenhagen to pursue a career in finance, and held management roles at several major investment banks before taking on his current role as the managing director of trading education experts Global Capital Markets Solutions (GCMS). He is the author of the “Reality Based Trading Guide“, a practical guide to forex and equities trading, and also headed up the Trader Training programme at Copenhagen-based investment bank and brokerage Saxo Bank.


