
Ross Mullins: Selling EURUSD at the Top of the Long Term Range
Starting here on the daily timeframe, I’ve zoomed way out, so we could see some long-term history for this currency pair. You go back to the left-hand side of the chart, back in 2014, this currency pair was clearly in a downtrend. You could see that over here on the far left-hand side of the chart. However, since January of 2015, just a little bit more than a year ago, we started developing a resistance area and range right about – the top of the range being right about – the 1.1400-level.
And you could see the red box in the EUR/USD that I have here on my chart going all the way back to January of 2015 and the resistance that this currency pair has had in that area. We’ve studied this quite a lot in the live, daily Trade Room. Zoom it in here again and you could see multiple times where the market found resistance. I’m going to scroll it over just a touch so that we could see some history here. You could see multiple times going back to the left-hand side. Resistance where the black X is. Resistance where the second black X is.
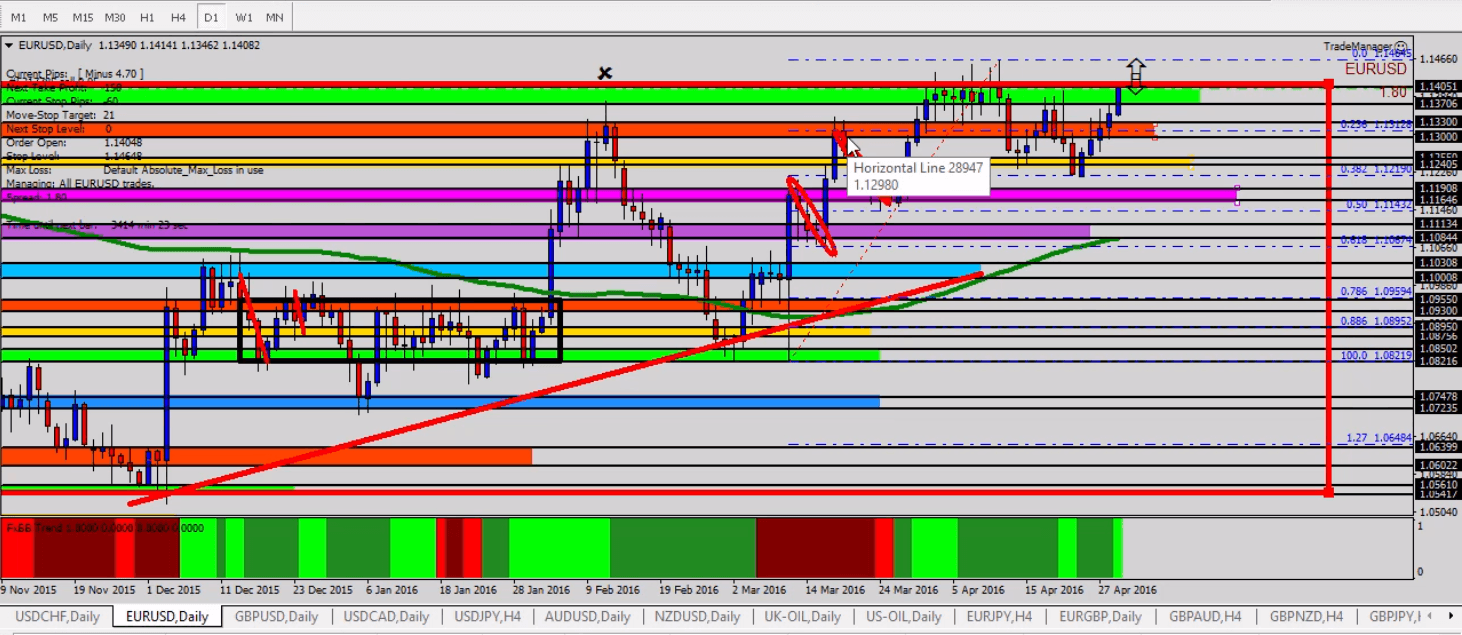
I’m just going to put a couple of black X’s to show us where the market has continually, for the past year or so, found resistance into the 1.1400-level. And today no different. We’re coming right into the 1.1400-level, and I’m looking for strength once again right there at that same price level. 1.1400. There’s only been one instance really where the market pushed through the 1.1400-level with any significance, and that was this one instance right here back in August of 2015. So, otherwise, it’s continual, even going further back into February and January of 2015, found resistance underneath this level.
Now, there’s been times where it pushed through it a little bit and then returned it, but definitely, the probability and statistic tells us that there is resistance here at 1.1400. So, that’s what we’re going to work with for the day today. Let’s go ahead and zoom it back in here on the daily timeframe. Get a little bit closer. You could see several weeks ago we found resistance here and worked that pretty slowly, making a profit on the way down, a couple of different times taking sells into the 1.1400-level there.
Source: Forex Traders Daily
José Ricaurte Jaén is a professional trader and Guest Editor / community manager for tradersdna and its forum. With a Project Management Certification from FSU – Panama, José develops regularly in-house automated strategies for active traders and “know how” practices to maximize algo-trading opportunities. José’s background experience is in trading and investing, international management, marketing / communications, web, publishing and content working in initiatives with financial companies and non-profit organizations.
He has been working as senior Sales Trader of Guardian Trust FX, where he creates and manages multiple trading strategies for private and institutional investors. He worked also with FXStreet, FXDD Malta, ILQ, Saxo Bank, Markets.com and AVA FX as money manager and introducing broker.
Recently José Ricaurte has been creating, and co-managing a new trading academy in #LATAM.
During 2008 and 2012, he managed web / online marketing global plan of action for broker dealers in Panama. He created unique content and trading ideas for regional newspaper like Capital Financiero (Panamá), La República (Costa Rica), Sala de Inversión América (Latinoamérica) and co-developed financial TV segments with Capital TV.
He is a guest lecturer at Universidad Latina and Universidad Interamericana de Panamá an active speaker in conferences and other educational events and workshops in the region. José Ricaurte worked and collaborated with people such as Dustin Pass, Tom Flora, Orion Trust Services (Belize) and Principia Financial Group.


