
Let’s review our Prodigy TradersDNA comments for #AUDUSD and #NZDUSD, where both currency pairs are rising into a couple of resistance zones that we want to pay attention to for the day today, looking for some trading opportunities.
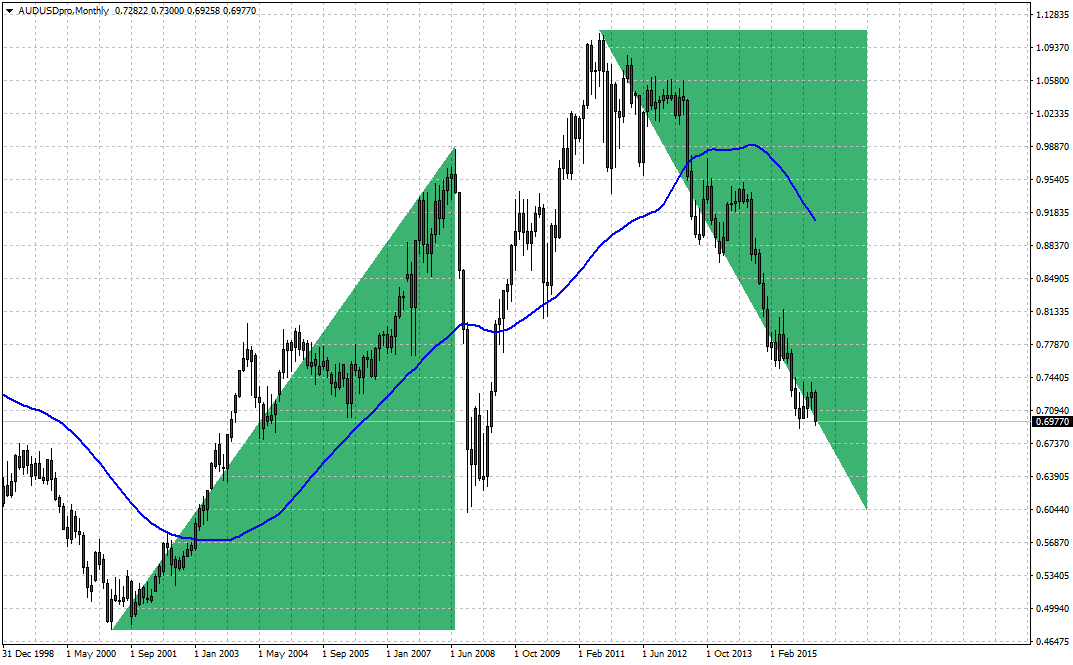
#AUDUSD, over the past several months, we’ve been studying this triangle pattern. The contraction or consolidation pattern between the two red trend lines, there the market had falling highs and rising lows. Over the past week or so, we have seen the breakout of that pattern.
Yes, indeed very interesting. If it continues to pressure lower, we look for a continuation of the previous downtrend. So, in that pattern of the trend, if we’re looking for the breakout and the continuation of the downtrend, there are two scenarios where we’re looking to go short or sell the currency pair. That’s a rally into resistance or a break underneath support, and we’re looking for lower risk and higher reward opportunities to do that.
If you take a look at the pink-shaded area here on the chart at the very bottom, just between the two green-shaded areas, you could see between 0.7010 and 0.7030. That’s the pink-shaded area highlighted. Of course you follow that back in time. You see the last support low that we’re seeing on the left-hand side of the chart. We also see some resistance back here. We see some support on this spike low over here. So, we know that this area right around or just above the 0.7000-level is a critical historical decision point where buyers and sellers are exchanging hands.
Let’s go ahead and zoom it in one more time here on the daily timeframe. So, we could see that coming into that pink-shaded area. Again, there’s your support on the left. Let’s take Fibonacci. Just one simple fib from the current resistance high, down to the current support low that we see down here at the bottom. So, from the high of the current blue trend line, down to the low puts the .236 Fibonacci retracement level right at 0.7020, right in the middle of our pink-shaded area.
Then, there is some historical support. This is going to be a primary decision point with low risk and high reward. The scenario is you’re looking to go short into the resistance level. We have of course the down trend line there. And we’re looking to target the next support, which is the green-shaded area down here. So, let’s just say from that 0.7020 Fibonacci level, down to low, we’re looking at 80, 85 to 90 pips of profit on the way down.
What’s the risk in this scenario? Well, the risk in this scenario is that it breaks above the pink-shaded area, so your stop losses are just above the pink-shaded area. So, if you measure that from the 0.7020-level right in the middle, where that Fibonacci level is, you’re looking at 30, maybe 35 pips of risk. So, you’re risking 30 to 35 pips. Potential gain: over 80 pips of profit. So, risk-reward is justified to go short into the pink-shaded area.
Our trading risk, again, we’re looking somewhere up here into this area right here, right around the 0.7050 to 0.7055-level for your stop loss. 0.7050 to 0.7055 if you’re looking to place a stop loss.
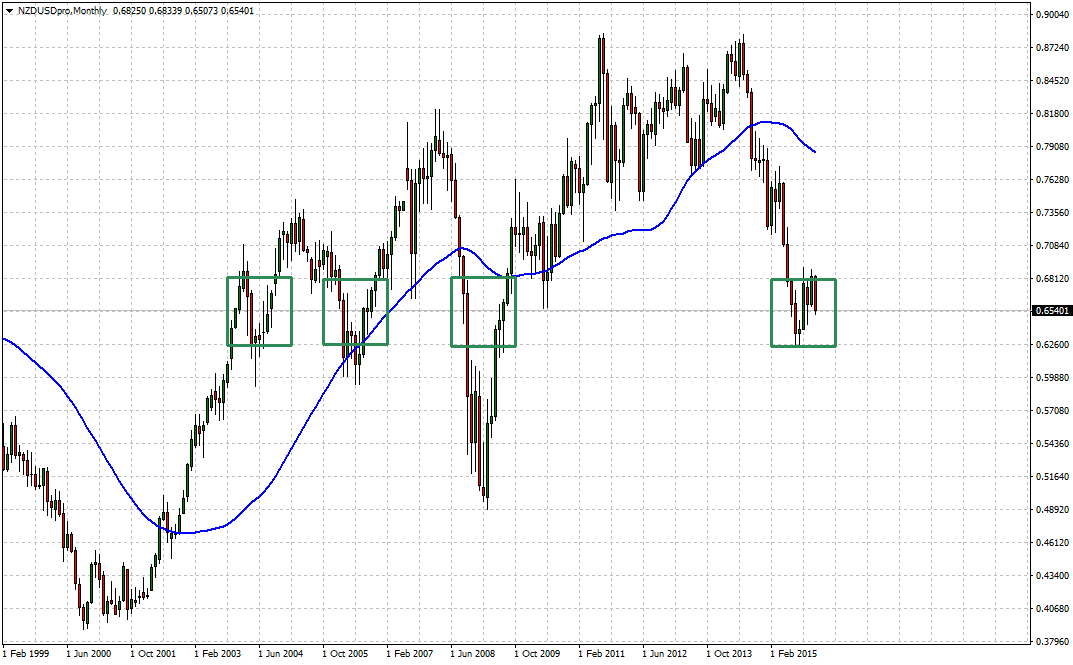
#NZDUSD we also have of course weekly timeframe. We’ve been studying the long-term red trend line, the downtrend that we’ve been seeing here. Turning to a daily timeframe, we could see the market has been in a little bit of a rise along the black trend line. We see it going up, but we’re challenging that today.
There’s that black rising trend line. We’re challenging that today. Here’s something else interesting. We’re also challenging the 100-period simple moving average. That’s that green, wavy line coming into the chart right here inside the green-shaded area. For the day today a similar scenario as #AUDUSD – 0.6570 to 0.6590. 0.6570 to 0.6590 is that green-shaded area. This is your resistance zone for the day today.
What’s the risk? That if it breaks above there and continues to go higher. What’s the potential reward? The potential reward is back down to the blue-shaded area. Take it down to the four-hour timeframe. Again, we have a known risk. We have a known potential profit target. We have the known trend. Of course it’s been working its way down for several days. We could see that here along the blue trend line. There’s your trend right now. You could see it working its way down, so we’re coming into that same trend line.
Let’s take a Fibonacci retracement measurement from the highest high that you see here on the chart, all the way down to the current low. That puts the .236 a little bit higher than our green zone, just into the 0.6600 or so. Maybe just shy of 0.6600 with the .236 fib, so we’re looking at it just above the green zone. So, clearly we have the green zone. We know that we don’t want it to break above there. That’s the risk in this scenario. It breaks above there and goes higher.
Prodigy Trader is a daily publication designed by Forex Traders Daily – All Rights Reserved. We encourage traders/investors to review Ross Mullins forex setups, comments and video analysis – Live Trade Room.
José Ricaurte Jaén is a professional trader and Guest Editor / community manager for tradersdna and its forum. With a Project Management Certification from FSU – Panama, José develops regularly in-house automated strategies for active traders and “know how” practices to maximize algo-trading opportunities. José’s background experience is in trading and investing, international management, marketing / communications, web, publishing and content working in initiatives with financial companies and non-profit organizations.
He has been working as senior Sales Trader of Guardian Trust FX, where he creates and manages multiple trading strategies for private and institutional investors. He worked also with FXStreet, FXDD Malta, ILQ, Saxo Bank, Markets.com and AVA FX as money manager and introducing broker.
Recently José Ricaurte has been creating, and co-managing a new trading academy in #LATAM.
During 2008 and 2012, he managed web / online marketing global plan of action for broker dealers in Panama. He created unique content and trading ideas for regional newspaper like Capital Financiero (Panamá), La República (Costa Rica), Sala de Inversión América (Latinoamérica) and co-developed financial TV segments with Capital TV.
He is a guest lecturer at Universidad Latina and Universidad Interamericana de Panamá an active speaker in conferences and other educational events and workshops in the region. José Ricaurte worked and collaborated with people such as Dustin Pass, Tom Flora, Orion Trust Services (Belize) and Principia Financial Group.


