Trading can be tough, and finding tools that actually help is a big deal. The MT4 supply and demand indicator is one of those tools that can really change how you trade. It helps you see important spots on the charts where prices might move, making your trading decisions a lot clearer. This article will go over what this indicator does and how it can help you trade better, whether you’re just starting out or have been trading for a while.
Key Takeaways
- The MT4 supply and demand indicator helps find key price areas where buying and selling pressure is strong.
- It can be set up to show zones from different timeframes, giving you a better picture of the market.
- Using this indicator can make it easier to figure out good places to get into and out of trades.
- It’s a useful tool for managing risk and improving your trading plan.
- This indicator can also help with trading across different markets and even with prop firm challenges.
Understanding the MT4 Supply and Demand Indicator
Defining Supply and Demand Zones
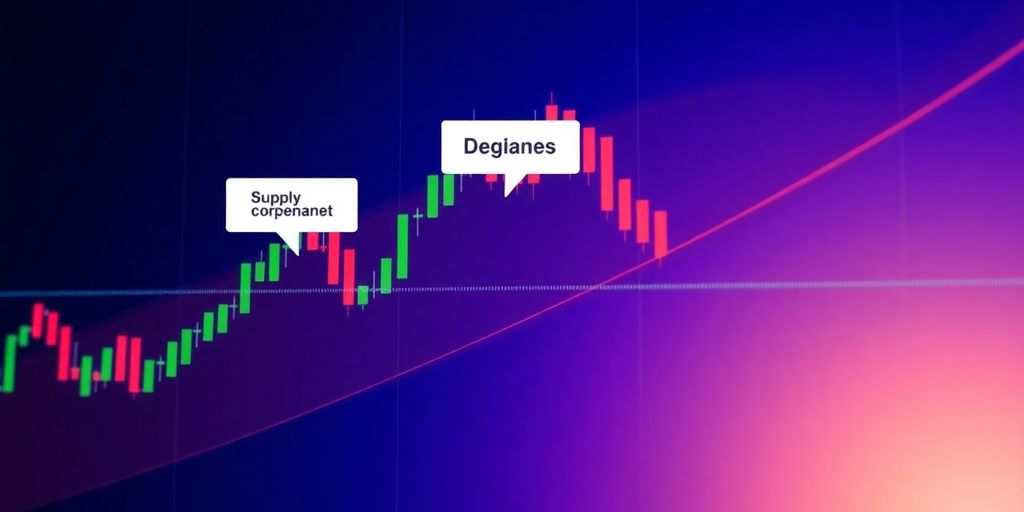
Okay, so what are we even talking about here? Supply and demand zones are basically areas on a price chart where significant buying or selling pressure is expected. These zones represent imbalances between buyers and sellers. When demand exceeds supply, prices tend to rise, creating a demand zone. Conversely, when supply exceeds demand, prices fall, forming a supply zone. Think of it like this:
- Demand Zone: A price level where buyers are eager to buy, pushing prices up.
- Supply Zone: A price level where sellers are eager to sell, pushing prices down.
- These zones aren’t exact prices, but rather areas of interest.
How the Indicator Identifies Imbalances
The MT4 supply and demand zone indicator does the heavy lifting for you. It uses algorithms to analyze price action and identify potential supply and demand zones. It looks for things like:
- Sharp price movements away from a specific area.
- Consolidation periods followed by breakouts.
- Areas where price has previously reacted strongly.
It’s not perfect, but it gives you a solid starting point. The Advanced Supply Demand Indicator MT4 is available for a small fee.
Visualizing Key Market Areas
Once the indicator identifies these zones, it plots them on your chart, usually as rectangular areas. This makes it super easy to see potential areas of support and resistance. The colors often differentiate between supply and demand zones. For example:
- Demand zones might be green or blue.
- Supply zones might be red or orange.
Using the indicator helps you visualize where price is likely to react, giving you an edge in planning your trades. It’s like having a map of potential turning points right on your chart. It’s important to remember that these zones are not foolproof, but they offer a great visual representation of potential trading opportunities.
Key Features of the Advanced MT4 Supply and Demand Indicator
Double Timeframe Zone Analysis
One of the coolest things about this indicator is its ability to show you supply and demand zones from two different timeframes at once. This helps you see the bigger picture and find those sweet spots where multiple timeframes align. It’s like having a secret weapon for spotting high-probability trades. For example, you might see a strong demand zone on the daily chart that also lines up with a smaller demand zone on the 1-hour chart. This kind of confluence can give you a lot more confidence in your trade setup. This is especially useful for supply demand traders.
Pinpoint Accuracy for Entry and Exit
Forget guessing where to jump in or take profit. This indicator uses some pretty smart algorithms to figure out exactly where the imbalances are between buyers and sellers. This means you can get really precise with your entries and exits, which can seriously improve your risk-reward ratio. It’s all about finding those areas where price is likely to bounce or reverse. Here’s a quick look at how it helps:
- Identifies key levels for potential entries.
- Suggests optimal stop-loss placements based on zone strength.
- Highlights potential take-profit targets within opposing zones.
Customizable Zone Strength and Alerts
Not all supply and demand zones are created equal, right? That’s why this indicator lets you tweak the settings to focus on the zones that matter most to you. You can adjust things like the minimum number of candles before a zone is drawn, how far price has to move away from the zone, and even set up alerts for when price breaks through multiple zones in a row. This is great for trend-following strategies. The customizable alerts are a game-changer, too. You can set them up to notify you when:
- Price enters a zone.
- A zone is broken.
- A new zone is formed.
Using customizable zone strength is important because it allows you to filter out weaker zones that are more likely to fail. This can help you avoid false signals and improve the overall accuracy of your trading. It’s all about finding the zones that have the most potential for a strong reaction.
Transforming Your Trading with the MT4 Supply and Demand Indicator
Enhancing Trade Setup Identification
Okay, so you’ve got this MT4 supply and demand indicator. Cool. But how does it actually change your trading? Well, first off, it can seriously help you spot better trade setups. Instead of just guessing where to jump in, you’re looking at areas where there’s a real imbalance between buyers and sellers. Think of it like this: the indicator highlights potential turning points, giving you a heads-up on possible price movements. It’s not a crystal ball, but it’s way better than flying blind. The TickFlow display helps you understand the market’s dynamics.
Optimizing Risk and Reward Ratios
This is where things get interesting. The indicator isn’t just about finding trades; it’s about finding good trades. By identifying supply and demand zones, you can set more informed stop-loss levels and profit targets. This means you can aim for higher reward relative to your risk. For example:
- Identify a demand zone where buyers are likely to step in.
- Place your stop-loss just below that zone.
- Target a supply zone above for potential profit.
A better risk/reward ratio doesn’t guarantee wins, but it does mean that even if you don’t win every trade, your profitable trades can more than make up for your losses. It’s about playing the long game.
Improving Overall Trading Discipline
Let’s be honest, trading can be emotional. The MT4 supply and demand indicator can help bring some much-needed discipline to your process. Here’s how:
- Clear Rules: The indicator provides clear, visual signals. This helps you stick to your trading plan instead of making impulsive decisions.
- Patience: Knowing where the key zones are encourages you to wait for the right opportunities, rather than chasing every little price movement.
- Objectivity: The indicator offers an objective view of the market, reducing the impact of your own biases and emotions.
Basically, it’s like having a trading buddy who’s always calm, cool, and collected, reminding you to stick to the plan. And who wouldn’t want that?
Leveraging the MT4 Supply and Demand Indicator for Multi-Asset Trading
Applying the Indicator Across Various Markets
Okay, so you’ve got the MT4 Supply and Demand Indicator humming along. Now, let’s talk about spreading the love – using it across different markets. Don’t just stick to one thing! The cool part is that supply and demand principles? They’re pretty universal. Whether you’re staring at currency pairs, dabbling in stocks, or even checking out commodities, the basic idea stays the same: price moves based on imbalances between buyers and sellers. The Supply Demand EA Pro can be a great tool for this.
Adapting Strategies for Different Asset Classes
Now, here’s where it gets interesting. While the core principles are the same, you can’t just copy-paste your strategy from, say, EUR/USD to crude oil. Different assets have different personalities. Volatility, typical price ranges, and even the news events that move them can vary wildly. For example:
- Currencies: Often react to economic data releases and central bank announcements.
- Stocks: Company-specific news and earnings reports are huge.
- Commodities: Supply disruptions, weather patterns, and geopolitical events can cause big swings.
So, you need to tweak your approach. Maybe you tighten your stop-loss on a less volatile asset or widen it on something that tends to jump around a lot. Pay attention to how the indicator performs on each asset and adjust accordingly. Backtesting is your friend here. Seriously, spend some time testing different settings and strategies on each asset class before you go live. It’ll save you a lot of headaches (and money) in the long run.
Diversifying Your Trading Portfolio
Think of it this way: don’t put all your eggs in one basket. Diversifying your trading portfolio is a smart move, and the MT4 Supply and Demand Indicator can help you do it effectively. By trading multiple assets, you’re spreading your risk. If one market goes south, you’ve got other positions that can potentially offset those losses. The key is to choose assets that aren’t perfectly correlated. If everything you’re trading moves in the same direction at the same time, you’re not really diversifying.
Diversification isn’t about guaranteeing profits or preventing losses. It’s about managing risk. By spreading your capital across different assets, you’re reducing the impact of any single trade or market event on your overall portfolio.
Here’s a simple table to illustrate the point:
| Asset Class | Potential Drivers | Risk Factors |
|---|---|---|
| Forex | Interest rates, economic data, political events | High volatility, leverage risk |
| Stocks | Company earnings, industry trends, market sentiment | Market corrections, company-specific risks |
| Commodities | Supply/demand imbalances, weather, geopolitics | Geopolitical instability, storage costs |
Mastering Prop Firm Challenges with the MT4 Supply and Demand Indicator
Prop firms have specific rules and expectations. Using the MT4 Supply and Demand Indicator can give you an edge in meeting those requirements. It’s all about consistency and smart risk management.
Strategic Zone Identification for Consistency
Prop firms value consistency. The indicator helps you find zones in a systematic way. This means you’re not just guessing; you’re using a defined method to find potential trades. This consistent approach can improve your chances of passing evaluations.
- Follow the indicator’s signals consistently.
- Document your zone analysis for review.
- Stick to your trading plan, even when it’s tempting to deviate.
Utilizing Fresh and Untested Zones
Fresh zones are key. These are areas where price hasn’t recently interacted. They often provide better opportunities because the supply or demand is still strong. The indicator can help you spot these fresh zones quickly.
Focusing on fresh zones can increase your win rate. These zones haven’t been exhausted by previous price action, making them more likely to hold.
Achieving Favorable Risk-Reward for Challenges
Prop firms look for traders who manage risk well. The indicator helps you identify entries and exits that offer good risk-reward ratios. This is crucial for passing challenges.
| Scenario | Risk | Reward | Risk-Reward Ratio | Outcome |
|---|---|---|---|---|
| Successful Trade | 1% | 3% | 1:3 | Pass Day |
| Unsuccessful Trade | 1% | 0% | N/A | Adjust Strategy |
| Breakeven Trade | 0% | 0% | N/A | Re-evaluate |
- Always calculate your risk-reward ratio before entering a trade.
- Aim for a minimum of 1:2 risk-reward.
- Use stop-loss orders to protect your capital. The Advanced Supply Demand Indicator MT4 can help with this.
Integrating Trendline and Channel Analysis with the MT4 Supply and Demand Indicator
Confirming Market Direction with Trendlines
Trendlines are a simple but effective way to confirm the overall direction of a market. By drawing lines connecting a series of higher lows (in an uptrend) or lower highs (in a downtrend), you can get a visual representation of the prevailing trend. Combining this with supply and demand zones can give you high-probability trade setups.
- Identify the primary trend direction using trendlines.
- Look for confluence between trendline support/resistance and supply/demand zones.
- Use multiple timeframes to confirm the trend.
Identifying Breakouts from Established Channels
Channels are formed by drawing parallel trendlines that encapsulate price action. A breakout from an established channel can signal a strong move in the direction of the breakout. Watching for breakouts from established channels can be a great way to find potential trade signals.
- Recognize consolidation patterns within channels.
- Spot potential reversal points at channel boundaries.
- Monitor price action as it approaches channel lines.
Combining Analysis for Stronger Trade Setups
Combining trendline and channel analysis with the MT4 supply and demand indicator can lead to more robust and reliable trade setups. Look for situations where trendlines, channels, and supply/demand zones all converge. This confluence of factors increases the probability of a successful trade. The advanced supply demand indicator can help with this.
By combining these analysis techniques, traders can filter out weaker signals and focus on high-probability setups. This approach promotes disciplined trading and can improve overall profitability.
Getting Started with Your MT4 Supply and Demand Indicator
Installation and Configuration Steps
Okay, so you’re ready to get this thing up and running? First, make sure you’ve got the MT4 platform installed. I mean, that’s kind of a no-brainer, right? Once you’ve downloaded the indicator file, usually a ‘.ex4’ or ‘.mq4’ file, open your MT4 platform. Go to ‘File’ -> ‘Open Data Folder’. From there, navigate to ‘MQL4’ -> ‘Indicators’ and paste the indicator file into that folder. Close the Data Folder and refresh your MT4 platform by right-clicking in the ‘Navigator’ window (usually on the left side of your screen) and selecting ‘Refresh’. The indicator should now appear in your list of custom indicators. Drag it onto your chart, and a settings window will pop up. Here, you can tweak things like zone colors, alert settings, and other parameters to fit your trading style. Don’t be afraid to experiment with these settings to see what works best for you.
Practicing with a Demo Account
Seriously, don’t even think about jumping into live trading right away. A demo account is your best friend here. Most brokers offer them, and they let you trade with virtual money, so you can get a feel for how the indicator works without risking any real cash. Use this time to test different strategies, see how the indicator reacts to various market conditions, and get comfortable with its signals. It’s like a flight simulator for trading – you can crash and burn as many times as you need without any real-world consequences. Pay attention to how the supply and demand zones form and how price reacts to them. Keep a trading journal to track your progress and identify areas where you can improve.
Transitioning to Live Trading Confidently
Alright, so you’ve put in the time with the demo account, and you’re feeling pretty good about your understanding of the indicator. Now it’s time to think about transitioning to live trading. But hold on, don’t go all in just yet. Start small. Really small. Trade with micro-lots or a very small percentage of your capital. This allows you to test your strategy in the real market with real money on the line, but without risking too much. As you gain confidence and consistently see positive results, you can gradually increase your position sizes. Remember, trading is a marathon, not a sprint. It’s all about consistent, disciplined execution and managing your risk effectively.
It’s important to remember that no indicator is perfect. The MT4 Supply and Demand Indicator is a tool to help you make better trading decisions, but it’s not a crystal ball. Always use it in conjunction with other forms of analysis and sound risk management principles. Don’t get greedy, and don’t let your emotions dictate your trading decisions. Stay disciplined, stay patient, and you’ll be well on your way to becoming a successful trader.
Conclusion
So, that’s the scoop on the MT4 Supply and Demand Indicator. It’s a pretty neat tool that can really help you see what’s going on in the market. It’s not some magic bullet, but it does give you a clearer picture of where prices might go. If you use it smart, along with other things you know about trading, it can definitely make a difference. Give it a shot, and see how it works for you. Happy trading!
Frequently Asked Questions
What does the MT4 Supply and Demand Indicator do?
The MT4 Supply and Demand Indicator helps traders find important price areas where buying and selling pressure is strong. It shows zones where prices might bounce or reverse, helping you make smarter trading choices.
How does the indicator find these special zones?
This indicator looks at how price moved in the past to find spots where lots of orders were placed. These spots are called supply and demand zones. It helps you see where big buyers and sellers are active.
Is this indicator good for new traders?
Yes, absolutely! The indicator is made for all kinds of traders, whether you’re just starting or have been trading for a while. It makes complex market analysis easier to understand.
Can this indicator really help me make more money?
It can! By showing you clear entry and exit points, and helping you understand where prices might go, it can improve how well your trades perform and help you manage your risk better.
Can I use this indicator for more than just one type of trading?
You can use it on different things you trade, like stocks, currencies, or even crypto. The main idea of supply and demand works across many markets, so you can use the indicator for different types of trading.
Will this indicator help me pass prop firm challenges?
Yes, it can be a great tool for prop firm challenges. By helping you find strong trade setups with good risk and reward, it increases your chances of passing those tough evaluations.