
GoCharting is making waves in the trading world with its innovative approach to multi-asset orderflow charting. This platform is designed to cater to the needs of traders by offering real-time data analysis, customizable charting options, and a variety of advanced technical indicators. Whether you’re a seasoned trader or just starting out, GoCharting provides the tools necessary to enhance your trading strategy and adapt to market changes.
Key Takeaways
- GoCharting offers real-time data analysis for accurate market insights.
- Users can customize charts with various indicators and drawing tools.
- The platform supports multiple asset classes, including stocks and cryptocurrencies.
- Traders can utilize a wide range of order types to manage their trades effectively.
- GoCharting’s user-friendly interface enhances the overall trading experience.
Innovative Features Of GoCharting
GoCharting is packed with features that aim to give traders an edge. It’s not just about pretty charts; it’s about providing tools that can actually help you make better decisions. Let’s take a look at some of the standout features.
Real-Time Data Analysis
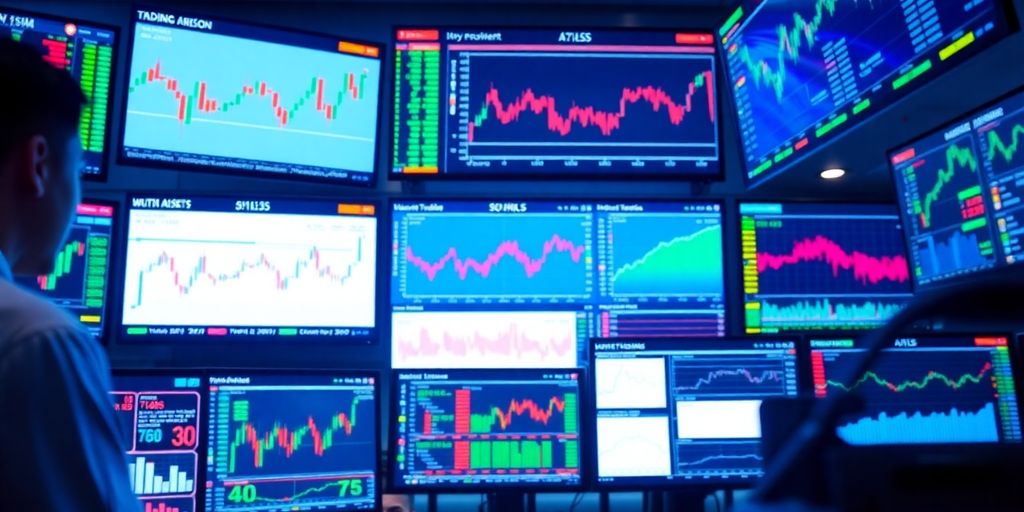
GoCharting’s real-time data analysis is a game-changer. It allows you to see what’s happening in the market as it happens, without delay. This is super important for making quick decisions, especially in fast-moving markets. You can track price movements, volume, and other key metrics in real-time, giving you a comprehensive view of market activity. This is a big deal if you’re into day trading or scalping, where every second counts.
- Instantaneous updates on price changes.
- Real-time volume tracking.
- Low-latency data feeds.
Customizable Charting Options
One of the things I appreciate most about GoCharting is how customizable it is. You can tweak almost everything to fit your trading style. Want to change the colors of your candlesticks? No problem. Want to add a bunch of different indicators? Go for it. The platform gives you a ton of flexibility to create charts that make sense to you. This level of customization is really helpful for tailoring your analysis to specific markets or strategies. If you are looking for GoCharting alternatives, make sure they have customizable charting options.
- Adjustable chart colors and styles.
- Customizable timeframes.
- Multiple chart layouts.
GoCharting’s customization options are a huge plus. Being able to tailor the charts to my specific needs makes a big difference in my analysis. It’s not just about making things look pretty; it’s about making the data more accessible and easier to understand.
Advanced Technical Indicators
GoCharting comes loaded with a bunch of advanced technical indicators. We’re talking about stuff like Volume Profile, VWAP, and various order flow indicators. These aren’t your run-of-the-mill indicators; they’re designed to give you deeper insights into market dynamics. For example, the Volume Profile can help you identify key support and resistance levels, while order flow indicators can show you where the big players are buying and selling. It’s like having a secret weapon in your trading arsenal.
Here’s a quick look at some of the key indicators:
| Indicator | Description |
|---|---|
| Volume Profile | Shows the volume of trading activity at different price levels, helping to identify support and resistance. |
| VWAP | The volume-weighted average price, used to gauge the average price at which an asset has traded. |
| Order Flow Tools | Tools that visualize the flow of buy and sell orders, providing insights into market sentiment. |
- Volume Profile analysis.
- Order flow footprint charts.
- VWAP calculations.
Understanding Orderflow Charting
What Is Orderflow Charting?
Okay, so what’s the deal with orderflow charting? Basically, it’s a way to look at the market that goes beyond just the price on a chart. Instead of only seeing where the price was, you get to see what’s happening right now with the orders that are driving that price. It’s like looking under the hood of the market. Orderflow charting involves tracking the real-time movement of buy and sell orders in the market.
Benefits For Traders
Why should you care about orderflow charting? Well, it can give you a serious edge. Here’s the breakdown:
- Spotting Support and Resistance: Orderflow can highlight levels where there’s a lot of buying or selling interest, which often act as support or resistance.
- Confirming Trends: Seeing strong orderflow in the direction of a trend can give you more confidence that the trend will continue.
- Identifying Reversals: A shift in orderflow can signal that a trend is losing steam and might be about to reverse. This can be invaluable for timing your entries and exits.
Orderflow analysis helps traders make informed decisions with clarity and confidence. It provides insights into market dynamics that traditional charting methods might miss, allowing for more precise entries and exits.
Key Features Of GoCharting’s Orderflow
GoCharting’s orderflow tools are designed to give you a detailed view of market activity. Here are some key features:
- Orderflow Footprint: This shows the volume of buy and sell orders at each price level, giving you a visual representation of the orderflow. It’s a great way to see where the big players are active.
- Real-Time Data: GoCharting provides real-time orderflow data, so you can see what’s happening as it happens. No more lagging indicators!
- Customization: You can customize the charts to show the data that’s most important to you. This includes things like order size, volume, and timeframes. This allows traders to tailor their analysis to their specific strategies and preferences. Check out the charting analytics available.
Here’s a simple example of how orderflow data might be presented:
| Price | Buy Volume | Sell Volume |
|---|---|---|
| 100.00 | 150 | 100 |
| 100.05 | 120 | 180 |
| 100.10 | 200 | 80 |
Diverse Charting Analytics
GoCharting isn’t just about basic charts; it’s about giving you the power to dissect market data in ways that make sense for your trading style. It’s like having a Swiss Army knife for market analysis. Let’s break down what makes GoCharting’s charting analytics stand out.
Variety Of Chart Types
GoCharting throws a whole bunch of chart types at you, way beyond your standard candlestick or line chart. We’re talking Renko, Kagi, Point & Figure, Heikin-Ashi, and even footprint charts. Each one offers a different perspective on price action and volume, so you can really analyze market dynamics with precision. It’s all about finding the right tool for the job.
Customization Capabilities
Want to tweak your charts until they’re just right? GoCharting lets you do exactly that. You can load up your charts with technical indicators, drawing tools, and play around with the layout until it fits your strategy like a glove. It’s about making the charts work for you, not the other way around.
Integration With Technical Tools
GoCharting plays nice with a bunch of technical analysis tools. This means you can combine different indicators and strategies to get a more complete picture of what’s going on. It’s like building your own custom trading dashboard, tailored to your specific needs.
Think of it this way: GoCharting gives you the building blocks, and you get to decide how to put them together. Whether you’re into complex order flow analysis or simple trend following, the platform has something to offer. It’s all about finding what works for you and using it to your advantage.
Multi-Asset Support In GoCharting
GoCharting really shines when it comes to handling different kinds of assets. It’s not just about stocks; you can trade pretty much anything you want, all in one place. This makes it super convenient, especially if you’re someone who likes to spread their investments around.
Trading Across Different Asset Classes
GoCharting lets you trade stocks, futures, options, and even cryptocurrencies. This variety is a big plus because it means you don’t have to switch between different platforms to manage your portfolio. It’s all right there, which saves a ton of time and hassle. I remember when I had to use three different apps just to check my investments – what a pain!
Benefits Of Multi-Asset Trading
Trading multiple assets can help you diversify your portfolio, which is a fancy way of saying you’re not putting all your eggs in one basket. If one market is down, another might be up, which can balance things out. Plus, it gives you more opportunities to make money. Here’s a quick look at some potential benefits:
- Diversification: Spreading investments across different asset classes reduces overall risk.
- Opportunity: Access to more markets means more chances to profit.
- Flexibility: Easily switch between assets based on market conditions.
User Experience Across Assets
GoCharting does a solid job of keeping the user experience consistent no matter what you’re trading. The charts and tools work the same way whether you’re looking at stocks or crypto, which makes it easy to jump between different markets. The interface is pretty intuitive, so you don’t have to spend hours figuring out how things work. Plus, having everything in one place makes it easier to keep an eye on all your investments. You can use the market trends tool to help you decide what to trade.
I’ve found that having all my assets on one platform makes it much easier to manage my portfolio. I can quickly see how everything is performing and make adjustments as needed. It’s a lot less stressful than juggling multiple accounts and trying to remember different passwords.
Order Types Available In GoCharting
Market And Limit Orders
Okay, so let’s talk about the basics. Market orders are pretty straightforward – you’re telling the system, "Hey, buy or sell this thing right now at whatever the current price is." It’s all about speed. Limit orders are a bit more strategic. You set a specific price you’re willing to buy or sell at, and the order only goes through if the market hits that price. It gives you more control, but there’s no guarantee it’ll actually execute. GoCharting handles both of these like a champ. It’s super easy to place them, and the interface gives you clear info on the current market prices so you can make informed decisions. Understanding the difference between market and limit orders is key to getting started.
Advanced Order Types
Now, things get interesting. GoCharting isn’t just about the basics; it also supports advanced order types that can really up your trading game. We’re talking about things like stop-loss orders, which automatically sell your position if the price drops to a certain level, helping you limit potential losses. Then there are take-profit orders, which do the opposite – they automatically sell when the price hits your target profit level. And don’t forget about bracket orders, which combine a stop-loss and a take-profit order into one, giving you a pre-set range for your trade. These advanced order types are all about automating your risk management and profit-taking strategies.
Managing Risk With Conditional Orders
Conditional orders are where things get really flexible. These orders only trigger if certain conditions are met. For example, you could set up an order to buy a stock only if it breaks above a certain resistance level, or sell if it falls below a support level. This lets you react automatically to specific market events without having to constantly monitor the charts. GoCharting makes it pretty easy to set up these conditions, with a clear interface for specifying your criteria. It’s a great way to automate your trading strategy and manage risk more effectively.
Using conditional orders can really help you stay disciplined and avoid emotional decisions. By setting up your rules in advance, you’re less likely to panic and make rash choices when the market gets volatile. It’s all about having a plan and sticking to it.
User Experience And Interface
GoCharting’s user experience is something I’ve been meaning to explore more, and honestly, it’s a mixed bag but mostly positive. It’s clear they’ve put some thought into making it accessible, but there’s always room for improvement, right?
Intuitive Design
Okay, so the first thing you notice is the layout. It’s not overly cluttered, which is a huge plus. The design aims for clarity, ensuring that even novice traders can quickly find their way around. I remember when I first started using charting platforms, I was completely overwhelmed by the sheer number of buttons and options. GoCharting does a decent job of avoiding that initial shock.
- Clear visual hierarchy
- Easy-to-understand icons
- Logical menu structures
Widget Customization
This is where GoCharting really shines. The ability to customize your workspace with widgets is fantastic. You can drag and drop different tools and charts to create a setup that perfectly suits your trading style. I’ve got my main chart, order entry panel, and news feed all arranged exactly how I like them. It’s a game-changer for efficiency. You can tailor the trading platform to your needs.
Efficiency In Trading
Efficiency is key when you’re trading, and GoCharting seems to understand that. The platform is generally responsive, and order execution is pretty quick. I haven’t experienced any major lags or delays, which is crucial when you’re dealing with volatile markets. The quick access to various order types and the ability to set up hotkeys definitely speeds things up. I’ve found that the platform integrations are also a plus.
One thing I appreciate is the focus on providing essential tools without unnecessary distractions. It helps me stay focused on the task at hand and avoid getting bogged down in irrelevant information. It’s a streamlined approach that I think many traders will find beneficial.
Future Developments In GoCharting
GoCharting is constantly evolving, with exciting developments on the horizon. The platform is dedicated to staying at the forefront of trading technology, ensuring users have access to the most innovative tools and features. Let’s take a look at what the future holds.
Upcoming Features
GoCharting is planning to introduce several new features designed to enhance the trading experience. These include:
- Advanced AI-powered analytics: Expect to see more sophisticated algorithms that can identify patterns and predict market movements with greater accuracy. This will help traders make more informed decisions.
- Enhanced mobile app capabilities: The mobile app will receive a significant upgrade, bringing more of the desktop platform’s functionality to mobile devices. This means you can monitor your trades and analyze the market on the go.
- Integration with more exchanges and data providers: GoCharting aims to expand its reach by connecting to a wider range of exchanges and data sources. This will provide users with a more comprehensive view of the market.
Enhancements In User Experience
User experience is a top priority for GoCharting. The team is working on several improvements to make the platform even more intuitive and user-friendly. One key area is widget customization, allowing traders to tailor their dashboards to display the information most relevant to their strategies. Another focus is on improving the platform’s speed and responsiveness, ensuring a smooth and efficient trading experience. The goal is to make multi-asset trading as seamless as possible.
Market Trends And Adaptation
GoCharting is committed to adapting to the ever-changing market landscape. This includes:
- Support for new asset classes: As new financial instruments emerge, GoCharting will integrate them into the platform, giving users access to a wider range of trading opportunities.
- Compliance with evolving regulations: GoCharting is dedicated to staying compliant with all relevant regulations, ensuring a safe and secure trading environment for its users.
- Incorporating user feedback: GoCharting values user feedback and actively incorporates it into its development process. This ensures that the platform continues to meet the needs of its users.
The future of GoCharting looks bright, with a focus on innovation, user experience, and market adaptation. By continuously adding new features, improving the platform, and staying ahead of market trends, GoCharting is poised to remain a leader in the world of multi-asset orderflow charting. Keep an eye out for these exciting developments in the months to come!
Wrapping Up: The Future of GoCharting
In conclusion, GoCharting is shaping up to be a game-changer in the world of trading. With its user-friendly design and a ton of features, it caters to both beginners and seasoned traders. The ability to customize charts and analyze order flow gives users an edge in understanding market movements. Plus, the support for various asset classes means you can keep everything in one place. As trading continues to evolve, tools like GoCharting will likely play a big role in how traders make decisions. If you’re looking to step up your trading game, this platform is definitely worth checking out.
Frequently Asked Questions
What is GoCharting?
GoCharting is a web-based platform that helps traders analyze financial data in real-time. It offers many tools for charting and technical analysis.
What types of assets can I trade on GoCharting?
You can trade various assets like stocks, futures, options, and cryptocurrencies on GoCharting.
How does orderflow charting work?
Orderflow charting shows how orders are placed in the market. It helps traders see market trends and make better decisions based on buying and selling activity.
Can I customize my charts?
Yes! GoCharting allows you to customize your charts with different indicators, drawing tools, and layouts to fit your trading style.
What are the different order types available?
GoCharting supports several order types, including market orders, limit orders, and advanced options like trailing stops and conditional orders.
Is GoCharting easy to use for beginners?
Yes, GoCharting has a user-friendly interface that makes it suitable for both new and experienced traders.


