
The Japanese yen seems to attract decent buyers in the Asian session. It is sending all the necessary signals for traders and investors to jump in the “Long” wagon.
However, before You jump, let’s consider for a moment the fundamental data that can be seducing retail clients to add those long positions. We always have to wonder: Is it worth my time and risk? Well, in financial markets you have those willing to risk dollars to earn pennies, but what do I know.
Tomorrow
Medium Impact Event
Coincident Index
Leading Economic Index
Wednesday
Medium Impact Event
Current Account n.s.a.
Thursday
High Impact Event
Bank of Japan Governor Kuroda Speech (I’m sure this is the one everybody wants)
Remember those are just catalysts and financial markets tend to operate on their memories; it seems a random behavior, but it is not. Charts provide far more information than many professionals accept. It just requires dedication to recognizing different trading patterns and price action.
On the other hand managing risk, that’s where we lack more information compare to all the buy and sell trading services. I think “risk” is the answer to “Why” traders and investors are adding USDJPY to their currency portfolios. They are willing to take the risk into the unknown to pocket a decent risk and reward ratio; according to them.
Together, we are going to review the charts and make a more informed decision on both cases long and short. At the end, which is right or wrong is useless, the key is…who makes the most money? That’s about it. No more, No less.
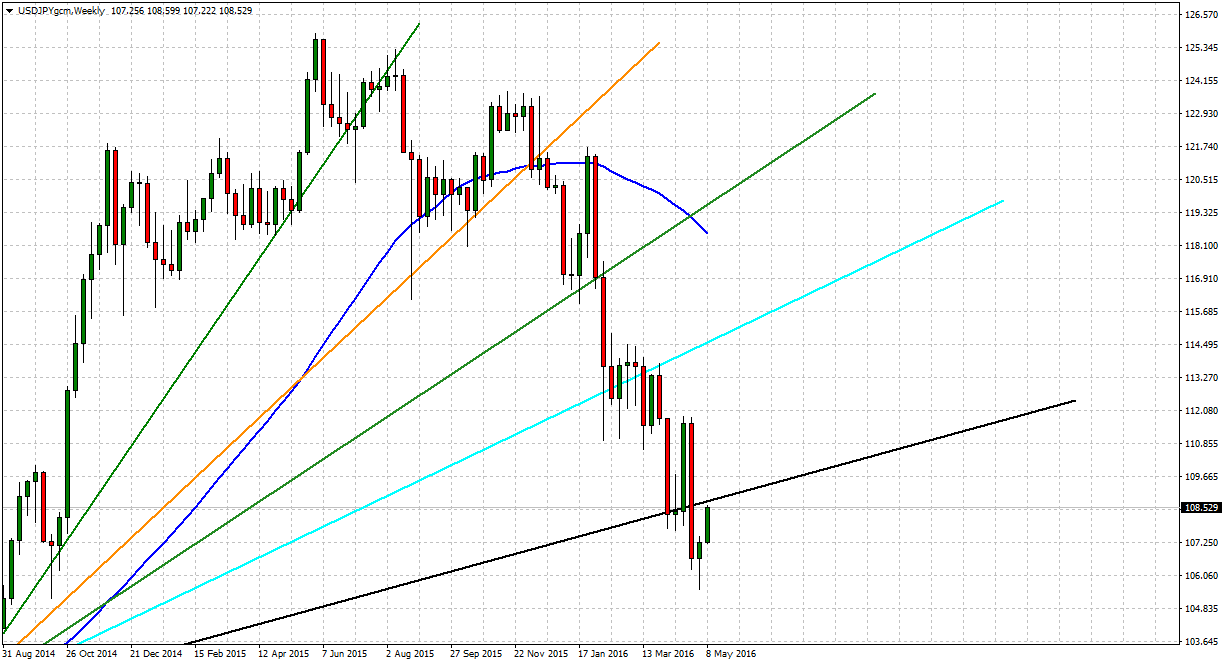
Weekly Chart View
It makes sense to think USDJPY found support 105.47; if you review its weekly chart you can see how the candlestick formation makes a bright figure that defines a “pin bar.” (price action formation that attracts buyers or sellers based on the circumstances)
Now, you can see how prices are moving fast to challenge the black trendline, somewhere around 108.80.
To add long positions, we should have evidence and a close and open above 108.80 resistance can provide further confirmation until that happens I rather wait for a pullback in the direction of the trend (or short-term correction)
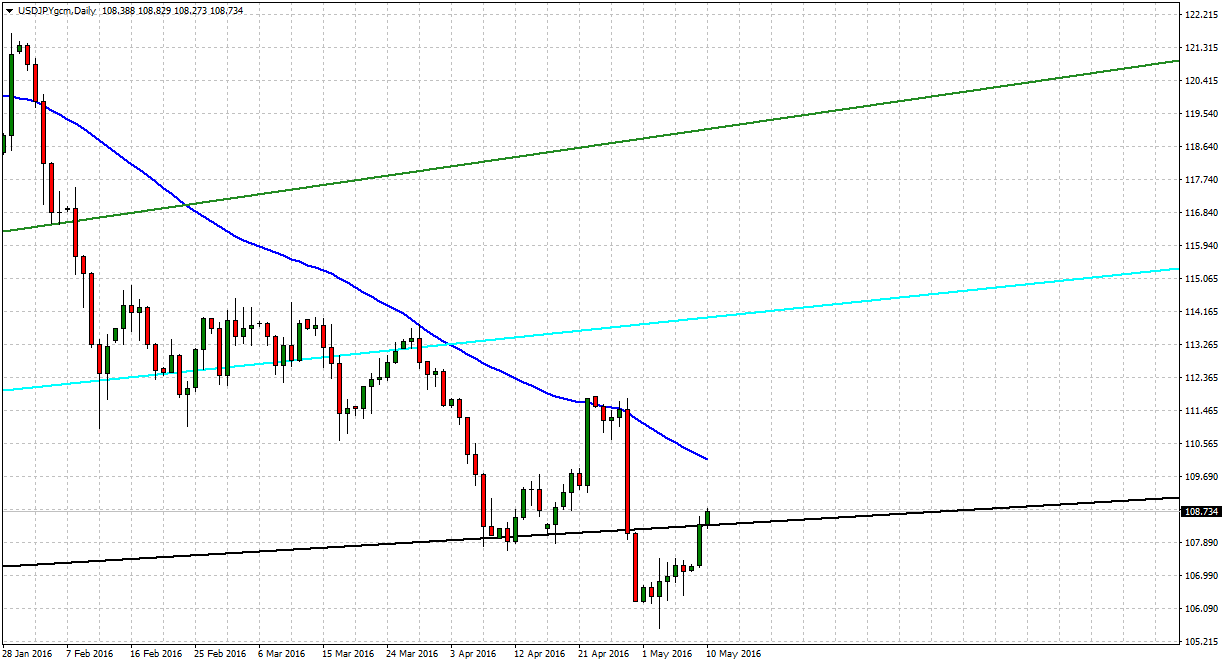
Daily Chart View
Another ball game on this chart. If we were to judge the price action, we have USDJPY trading above a previous support trendline protected twice and later broken to the downside.
It can easily be now the opposite. This trendline is a resistance and if prices keep trading above it may represent support once more.
Based on the information provided, you can easily add long positions. On the first chart, USDJPY challenges a weekly resistance, therefore, makes more sense.
Score goes 1 Short vs. 1 Long
Let’s keep moving!
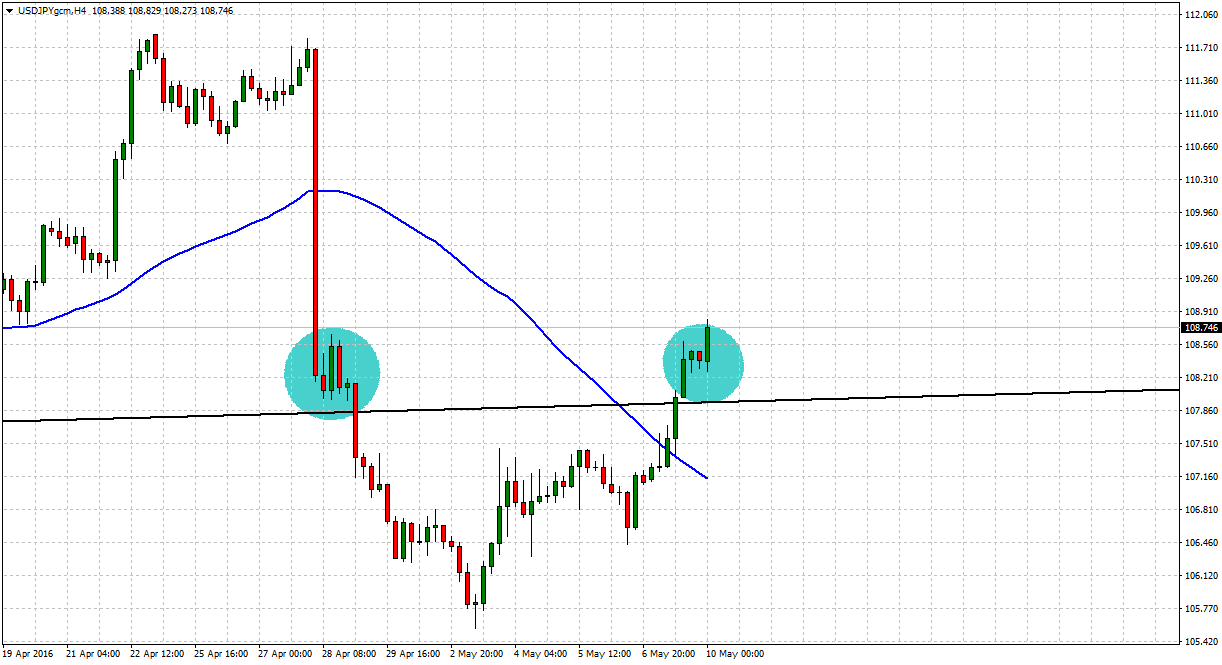
H4 Chart View
Nothing more to discuss!
Price is trading above its 50 SMA (blue color), and we need to add the fact is trading above that same trendline (black color) but wait a moment, look at those two blue eclipses; what are those telling you?
The first one worked as congestion and continuation of the trend. This time, it can do the same, but just in an uptrend.
Kuroda speaks in three days, traders and investors are fighting to improve their results in 2016. The collective wisdom seems to bet, going long US dollars against the Japanese yen is going to solve all their track record problems. It may, in the short-term, but without growth and market consumption that “Risk-on” trade can last until the next drama burst.
Final Score USDJPY: 1 Short vs. 2 Long
Having two charts indicating a long opportunity, we cannot be blind and with risk around 107.88 there is a Trade Idea to add with a 1:2 risk-reward, then:
Long USJDPY Market @ 108.63
Risk: 88 pips, Target: Always use 1:2 risk-reward calculation (look for the target, do not be lazy)
José Ricaurte Jaén is a professional trader and Guest Editor / community manager for tradersdna and its forum. With a Project Management Certification from FSU – Panama, José develops regularly in-house automated strategies for active traders and “know how” practices to maximize algo-trading opportunities. José’s background experience is in trading and investing, international management, marketing / communications, web, publishing and content working in initiatives with financial companies and non-profit organizations.
He has been working as senior Sales Trader of Guardian Trust FX, where he creates and manages multiple trading strategies for private and institutional investors. He worked also with FXStreet, FXDD Malta, ILQ, Saxo Bank, Markets.com and AVA FX as money manager and introducing broker.
Recently José Ricaurte has been creating, and co-managing a new trading academy in #LATAM.
During 2008 and 2012, he managed web / online marketing global plan of action for broker dealers in Panama. He created unique content and trading ideas for regional newspaper like Capital Financiero (Panamá), La República (Costa Rica), Sala de Inversión América (Latinoamérica) and co-developed financial TV segments with Capital TV.
He is a guest lecturer at Universidad Latina and Universidad Interamericana de Panamá an active speaker in conferences and other educational events and workshops in the region. José Ricaurte worked and collaborated with people such as Dustin Pass, Tom Flora, Orion Trust Services (Belize) and Principia Financial Group.


