


Forex Weekly Outlook: 7 Major US Currency Pairs
Let’s get started with our forex weekly outlook here with the US Dollar versus the Swiss Franc [USDCHF]. We’re looking at the daily timeframe. In the live, daily Trade Room, we’ve been discussing this downward-facing channel here. The two red trend lines that you see here on my chart. Downward-facing channel. Throughout the past couple of weeks, we’ve been studying the rising within that pattern.
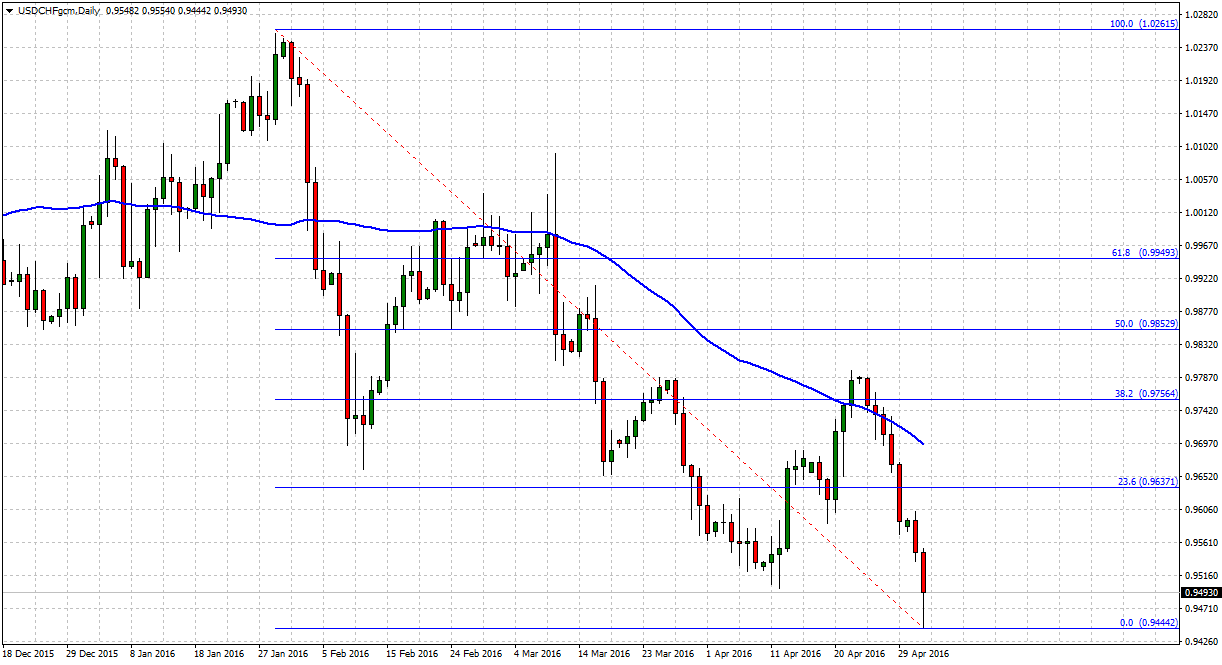
Previously, along the blue trend lines, we saw it find a low along the bottom and rise all the way to the top. In a recent pattern, we saw it find a low, but not making it all the way – quite all the way – to the top of the pattern, and now falling back down towards the mid-0.9500s. Of course that doesn’t mean we have turned all the way back down and we’re going to see it go all the way back down to the bottom, but definitely something to take note of is the fact that we have not completed the pattern this time so far and moved all the way to the top of the range.
If it starts to go bullish again, we would of course look to target back to the top of the range, but currently, last week, the market was clearly bearish here for the USDCHF. Of course, like I said, we have news events all this week that could change everything that we’re looking at here on this currency, but definitely, at least at this current point, we have a bearish momentum built into the market.
Let’s go ahead and zoom in a little bit here on the daily timeframe. Five days in a row it’s been going down. Doesn’t mean it has to continue down, but definitely something that you would take note of. If you’re looking to sell in this direction, there’s two reasons to sell it. I think, first off, you would look for it to come back up here into this pink zone, close to the 0.9600-level, if you’re looking to go short. I don’t think at the current moment it’s a good idea to go short because we’re clearly into the support level, into the mid to upper-0.9500s, the green-shaded area.
So, currently the green-shaded area is our support. If you’re looking to go short again, it either needs to go up to the pink zone or break through this green-shaded area, and then we could look for it to tackle the next support, which is down here at the purple-shaded area. If we start to see some evidence of reversal, maybe a break above the pink zone, we might look for the bullish action to return, but currently bearish, and I think that’s probably the direction at least for the first part of this week that we’ll continue to focus our efforts on.
Down here to the four-hour timeframe. You could see it’s kind of stuck right now between the pink and the green-shaded area. So, what I would expect that we’re looking for is a breakout of this congestion that we’re in right now. Above it, may start to signal the upside again for the USDCHF. Below it, as it is right now, and getting below the green-shaded area, further movement down towards the 0.9500-level would likely be expected. So, watching for a breakout of this congestion will probably be your key to direction for the USDCHF this week.
Moving on to the Euro versus the US Dollar [EURUSD] for our forex weekly outlook. We have been studying the long-term range. Let me zoom out to the weekly chart real quick and you could see that range. The red box that’s here on the chart. So, I definitely want to make note of that again today. Downtrend 2014. Since January of 2015, we’ve been stuck inside this range, the red box.
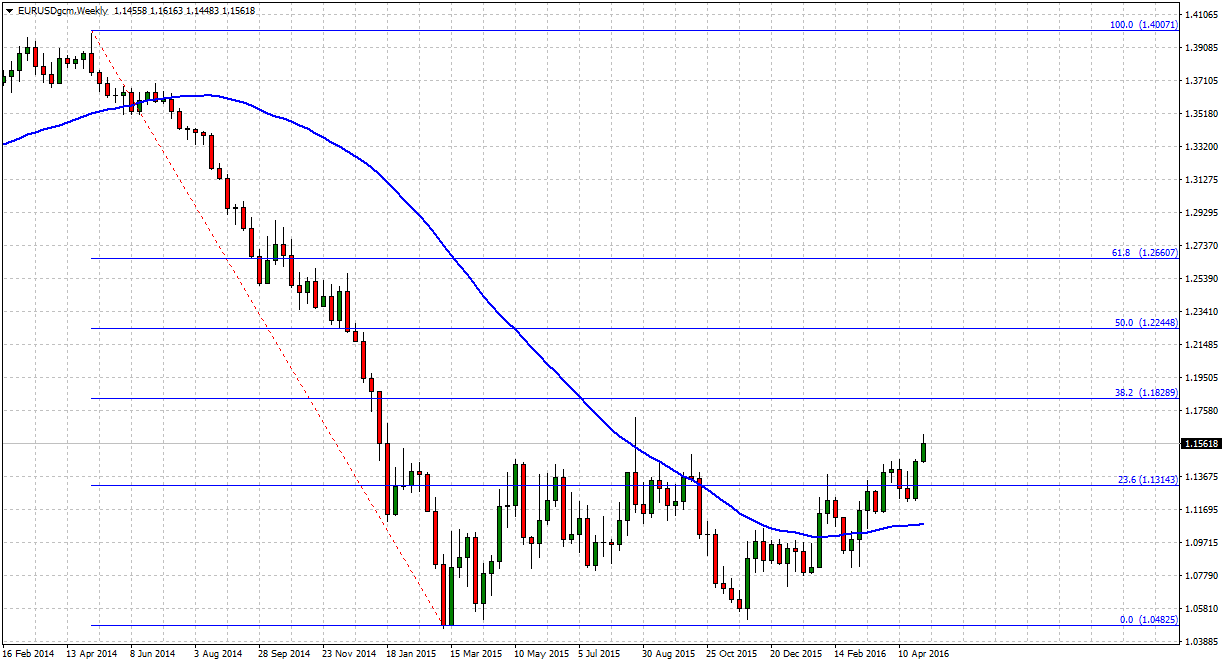
Now, I don’t think we can satisfactorily say we’re outside of it. Now, we are price action-wise outside of it, but have we broken it? We’ve seen it open above the red box before. You see it over here on the left-hand side. We’ve seen it tackle up here into the upper-1.1400s, towards 1.1500 before, and then reverse and go back down. So, until this really has a satisfactory clear clue to a breakout here, I think we have to watch for the potential of reversal here for this currency pair again, just like we did back here on the left-hand side.
Daily timeframe. Doesn’t really change that a lot. We see it challenging back up here at the pink zone. Again, we’ve seen that before. Take a look over here on the left-hand side. Just underneath the 1.1500-level it found resistance and then suddenly turned around and went back down. So, we can’t really call this a breakout yet I think, until we get through the 1.1500-level. Maybe, if you’re going to buy this currency pair, it needs to get through the 1.1500-level, the pink zone here, or it needs to dip back down to the green zone. Those are your reasons to go long. I would never suggest going long at the top of this trend and really into our resistance zone that we’re at the right now, into the 1.1415-level.
So, at least at this point, it’s not a buy scenario, but dips to the green zone, back to 1.1400, or back above 1.1500, the pink zone could be a buy scenario for you. Otherwise, I think at least for this first part of the week today, we’re looking at potential clues for resistance and reversal from the pink-shaded area.
Four-hour timeframe. I don’t think we have any evidence of reversal yet. We do have a little bit of a gap here, but that’s likely been filled. Definitely watching at resistance for resistance right here at the pink-shaded area today, underneath the 1.1480, 1.1500-level. If it continues to find resistance, we’ll target back down here towards the green-shaded area. I’m not in a short right now, but definitely watching for opportunities.
We do have, a little bit later on today, coming up at 10AM Eastern US time, ECB President Draghi speaking, so that may have some influence whether this goes up or down today for the EURUSD.
Moving on to the GBPUSD to continue with our forex weekly outlook. Important to note that we do have a UK bank holiday today, so we have less volumes of traders in the market today. But definitely a thing to note here on the daily timeframe is this black box, and for the past four and now the fifth day we’re inside this little period of congestion, the black box that you see here on my chart. A break above it signals higher. Break below it would signal lower, but we need a breakout.
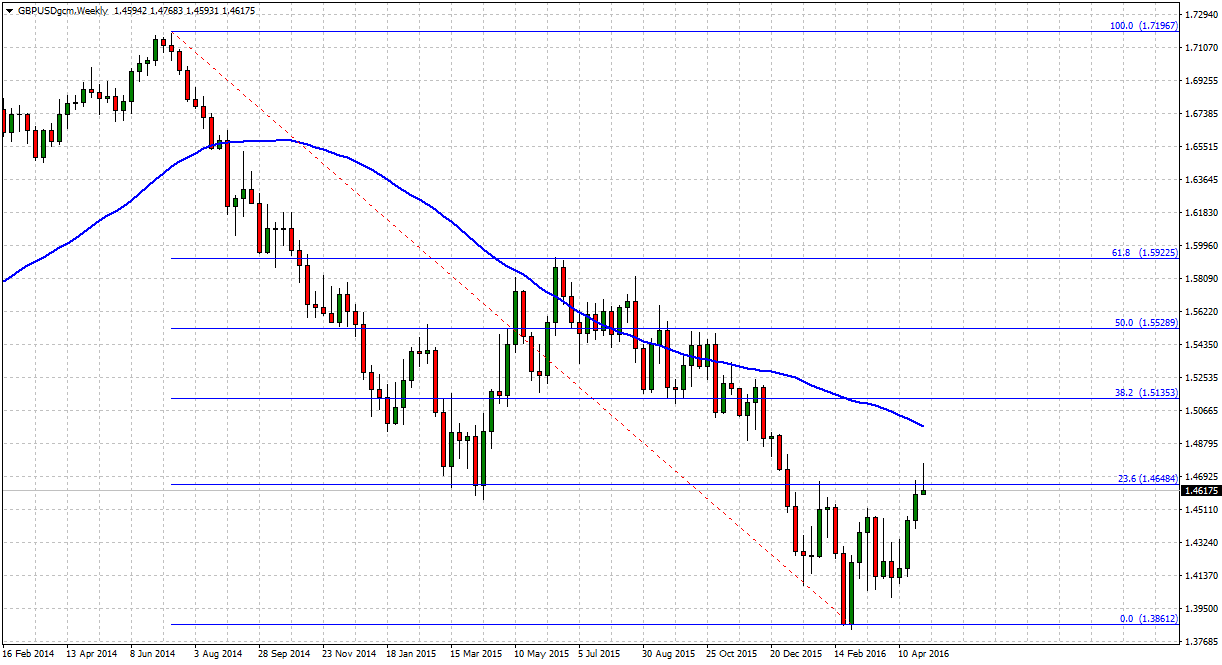
So, definitely right now cautious about buying this currency pair because four previous days have found resistance underneath the 1.4460-level. So, I’m not really keen on buying it right now, as long as it’s inside here. The reason to buy it would be a breakout above it or a dip back down to the bottom of that black box and the orange-shaded area. So, if you’re a buyer, and that’s clearly the direction the market is going in, you want to wait for the breakout above 1.4660 or so for the continuation of the uptrend.
Take it down to the four-hour timeframe. Let me squeeze this out a little bit, so we could see this better. There’s that same black box. There’s the same pink-shaded area. We’ve seen it touch the top here – 1.4660 – before and then reverse. So, don’t get too excited about buying this yet, until it breaks through that level. To me, a breakout is a single candle body that opens and closes above a resistance, so that’s what I’d be looking for here on the GBPUSD.
Moving on to the USDCAD. Clearly a downtrend. We’ve been focused in on the downtrend for quite a long time in the live, daily Trade Room. That’s the direction we want to trade it. However, it doesn’t matter if you’re selling used cars, t-shirts, candy bars, or currency pairs. It’s not very prudent to sell something at the very bottom of the trend. The very lowest price it’s been for multiple months. So, if we’re going to go short here on this currency pair, indeed I think it needs to go back up a little bit to give us a better price for our investment or at least give a clue and a signal to a breakout lower.
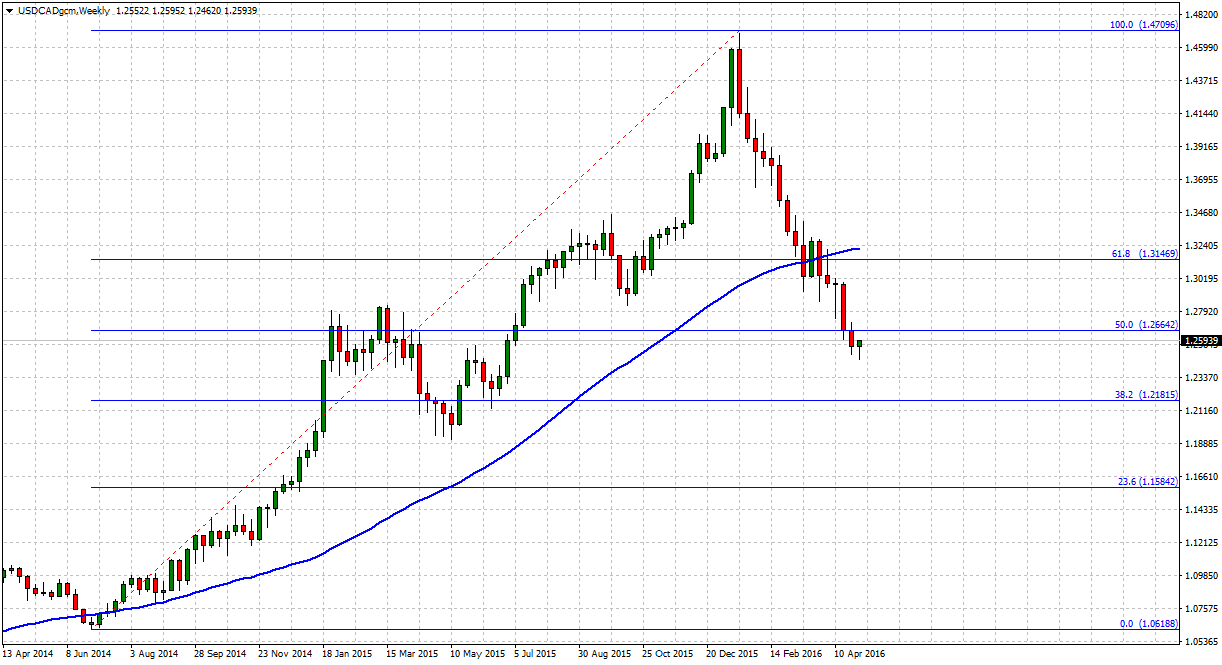
Right now 1.2515 or so. 1.2515 is holding our support. That’s the red line that you see at the very bottom of the chart. Zoom it in a couple of times. Nothing really new here. Three days now finding support here. We know that the green zone is support. It will need to break that if we’re going to go short again, or like I said, the reason you go short on anything or sell anything is it goes up to a higher price. So, at least at this point, it either needs to go back up to the pink zone that sits up here closer towards where this red trend line is, or it breaks through the green-shaded area.
I see no evidence or reason to go long on the USDCAD, but definitely watching for opportunities on rallies to resistance or breakouts underneath support for the continuation of the downtrend for the USDCAD.
Moving on to the USDJPY. Again, similar to what I just mentioned on the USDCAD, difficult to suggest selling at the very bottom of the trend. The lowest price it’s been for multiple months. However, any rallies back into resistance become an opportunity, or a break through support. Let’s go ahead and zoom it on down to the four-hour timeframe because last week we found some support here. After the significant fall after the BOJ last week, we found support here. Four hour candles finding support right about or just above the 107-level. Now we’re underneath it, so that same area of congestion and support – the 107-level – becomes that opportunity on any rally to resistance to potentially take a short.
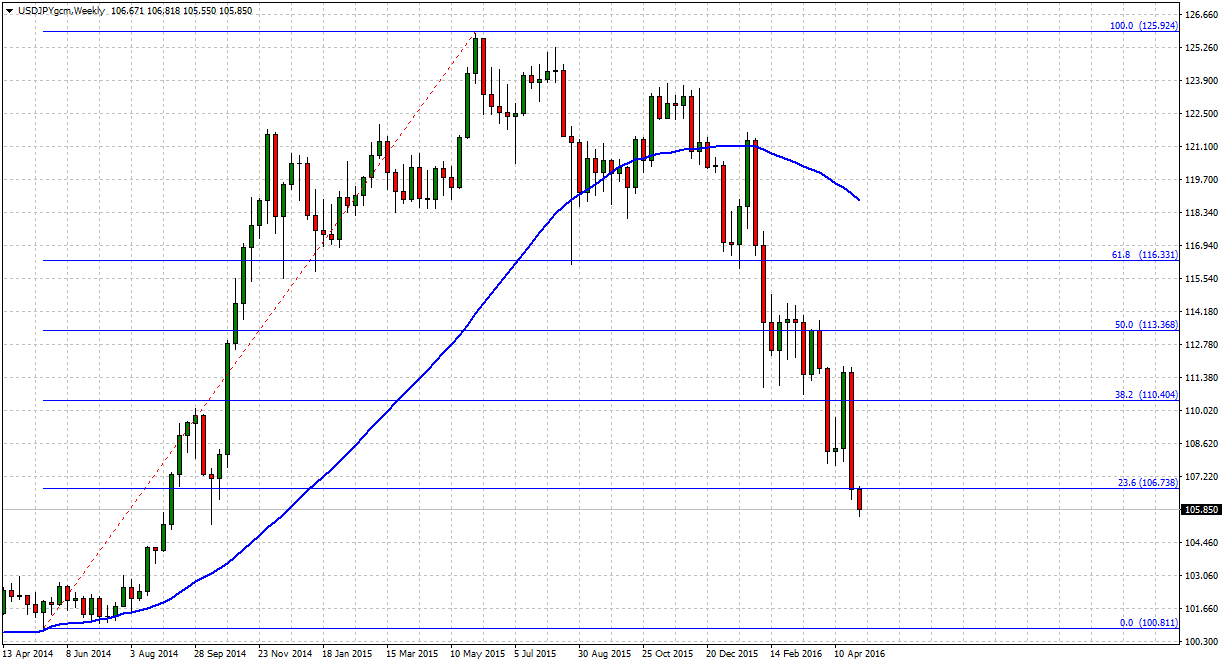
Now, there’s a good chance it could also take a turn back to the green-shaded area with these historical supports on the left-hand side, but one of these two areas. Either 107 or into the upper-107s become our resistance for the day today. We don’t really want to go long. There’s no evidence of reversal here yet for this currency pair to go long, but definitely watching for opportunities on rallies to resistance to go short here. Not really a great opportunity on the breakout of support, but if it does break through 106, I think back down here into 105.30, 104.80 becomes our next target, all the way down to this blue-shaded area here. Into the 105-level or so becomes our next target lower. So, rallies to resistance become selling opportunities. Until we get some evidence and clue of reversal here for the USDJPY.
Moving on over to the Australian versus the US Dollar [AUDUSD]. We do have some significant interest rate news later on this evening or morning, depending on where you are. 12:30AM is the list on the Forex Factory calendar for the rate information out of Australia. If it’s a surprise, if it changes, surprise change or the statements are hawkish or dovish tone by the RBA, we definitely would watch for this changes in this, but currently we have seen of course our long-term uptrend. We’ve seen our resistance high and now it’s broken back underneath historic resistance levels.
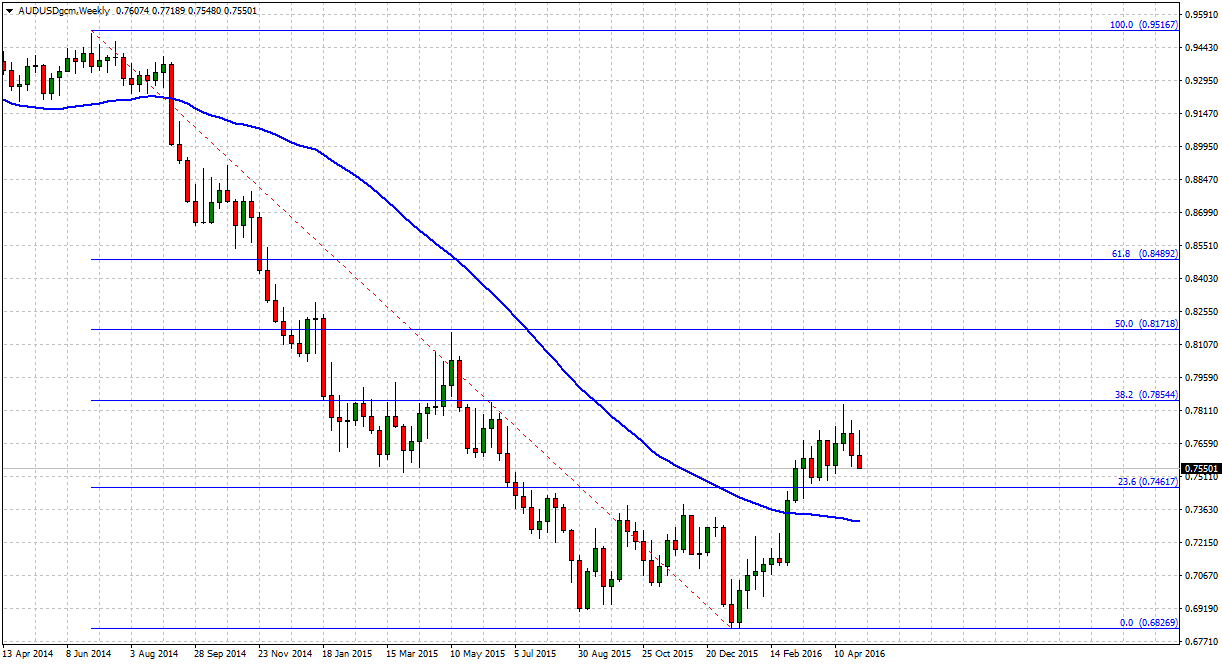
The red circles here show you where three resistance levels are. It’s broken underneath there. That’s right around the 0.7700-level. So, right now 0.7700 will be a key point to watch. 0.7700 as resistance. Three times over here on the left. A break through that resistance and 0.7700, above there, we likely look for the turn back higher again. Again, watching that interest rate news today could be a key player here for the AUDUSD.
Four-hour timeframe. We could see the pattern so far has been. It broke. Made a new high. Then, all of a sudden, it started making a new lower high. One lower high. Now we’re looking for the potential of a new, second lower high I guess I would say. One, two, and now the third lower high, but anyways. We’re looking for resistance here into the green-shaded area. 0.7700. That becomes a potential selling opportunity with fairly minimal risk. If it breaks 0.7700, you don’t want to likely stay in it very long, likely going all the way back to the yellow zone or higher if it breaks 0.7700.
Again, interest rate news today will be a key player here for the AUDUSD, but resistance becomes an opportunity to go short. Break of support, which I think right now would be the opportunity down here at the pink-shaded area. Really no reason yet to go long. I think the first opportunity to go long would be a challenge above 0.7700 and the green-shaded area, and of course interest rate change this evening. A surprise interest rate change may change everything we just spoke about here on the AUDUSD. But at least at this current point, watching 0.7700.
Moving on to the New Zealand Dollar versus the US Dollar [NZDUSD]. We could see the rising trend channel we see here. The red trend lines that are on the chart. We’ve been studying that in the Trade Room over the past several weeks, but dips to support, breaks of resistance become opportunities to go long in that channel, but watching for resistance. Clearly the last time we challenged here into the mid-0.7000s, 0.7050, 0.7060, we found resistance at the purple-shaded area and reversal. So, as we approach 0.7050 or so, we’ll definitely watching for resistance.
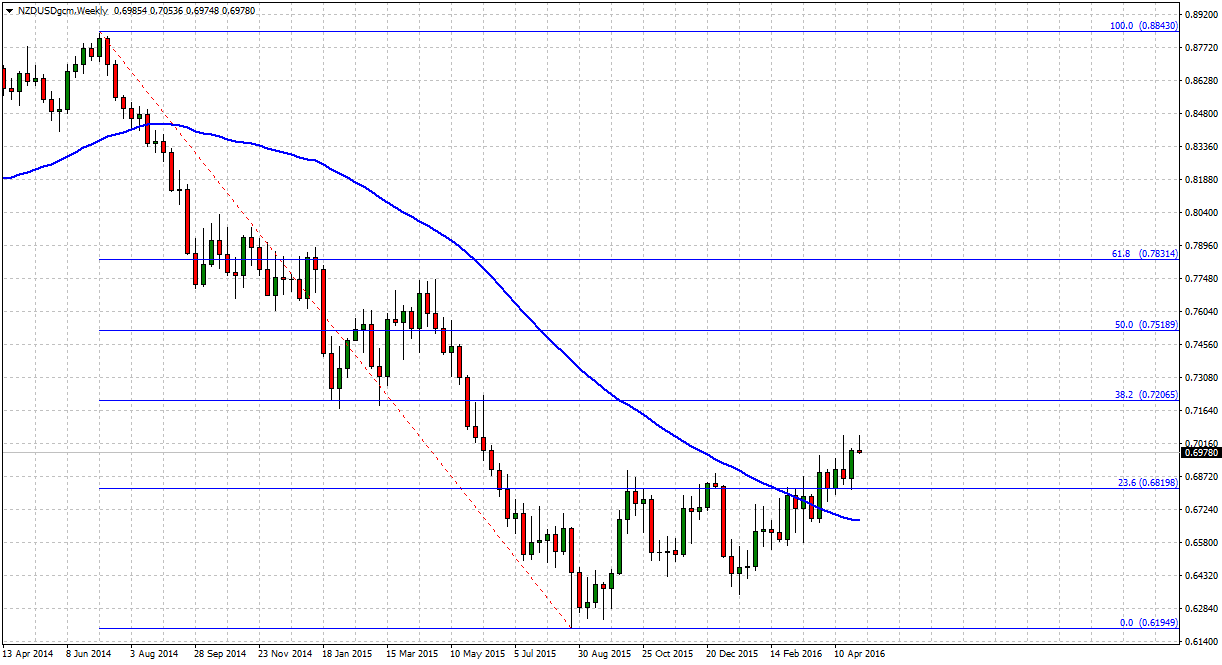
Let’s zoom it in a couple of times here on the daily timeframe. Again, look at that purple-shaded area. Right here it found resistance. Significant reversal. We’re approaching it now. The closer it gets to 0.7050. I would be discouraged about going long here on the NZDUSD the closer it gets to 0.7050. If you’re going to go long, look for the orange-shaded area to be your very best opportunity to do that for the day today.
So, back at the orange zone, 0.6980 or so, 0.6950 becomes an opportunity to buy towards 0.7050. You’ve already missed it for the day today likely. As it approaches 0.7050, resistance and reversal will be what you’re watching for. Four-hour timeframe. It doesn’t really change it except for the fact that here on the four-hour timeframe, we’ve now seen some candle bodies open and close above the orange zone, again, giving you a little bit more confidence in the continued rise. So, if you’re looking for an opportunity today, at least closest opportunity, I think a dip to the orange zone becomes a buy scenario, targeting the purple zone. Otherwise, hitting the purple zone becomes an opportunity to look for resistance or reversal for the NZDUSD today.
Source: Forex Traders Daily
José Ricaurte Jaén is a professional trader and Guest Editor / community manager for tradersdna and its forum. With a Project Management Certification from FSU – Panama, José develops regularly in-house automated strategies for active traders and “know how” practices to maximize algo-trading opportunities. José’s background experience is in trading and investing, international management, marketing / communications, web, publishing and content working in initiatives with financial companies and non-profit organizations.
He has been working as senior Sales Trader of Guardian Trust FX, where he creates and manages multiple trading strategies for private and institutional investors. He worked also with FXStreet, FXDD Malta, ILQ, Saxo Bank, Markets.com and AVA FX as money manager and introducing broker.
Recently José Ricaurte has been creating, and co-managing a new trading academy in #LATAM.
During 2008 and 2012, he managed web / online marketing global plan of action for broker dealers in Panama. He created unique content and trading ideas for regional newspaper like Capital Financiero (Panamá), La República (Costa Rica), Sala de Inversión América (Latinoamérica) and co-developed financial TV segments with Capital TV.
He is a guest lecturer at Universidad Latina and Universidad Interamericana de Panamá an active speaker in conferences and other educational events and workshops in the region. José Ricaurte worked and collaborated with people such as Dustin Pass, Tom Flora, Orion Trust Services (Belize) and Principia Financial Group.


