


The US dollar faced a difficult week as the Fed provided no grounds for future hikes in 2016. After FOMC, traders and investors, continue to navigate around the euro zone post-Brexit environment plagued with multi-risk events before 2016 sees its last trading day. However, at the end of the week, the Canadian Dollar received no better news failing to keep its bullish momentum.

The US dollar versus the Canadian Dollar started August trading on the H4 chart below its 50 SMA which serves as a necessary filter in technical analysis to have a more reliable direction; not 100% perfect but it provides traders and investors with a map. Eventually, prices traded for seventeen sessions to break again below the moving average and continue its bearish trend; under these circumstances, all evidence indicates two strategies:
- Selling Resistance
- Selling Breakouts below Support – Confirm Close and Open
As I want to trade risk (let’s avoid trading on magic oscillators and multiple indicators), USDCAD concentrates most of it around 1.26095 where demand seems to allocate interest in this currency pair. Therefore, Thursday night which translates in early trading hours for Tokyo, then the Loonie lost ground as crude traded lower.
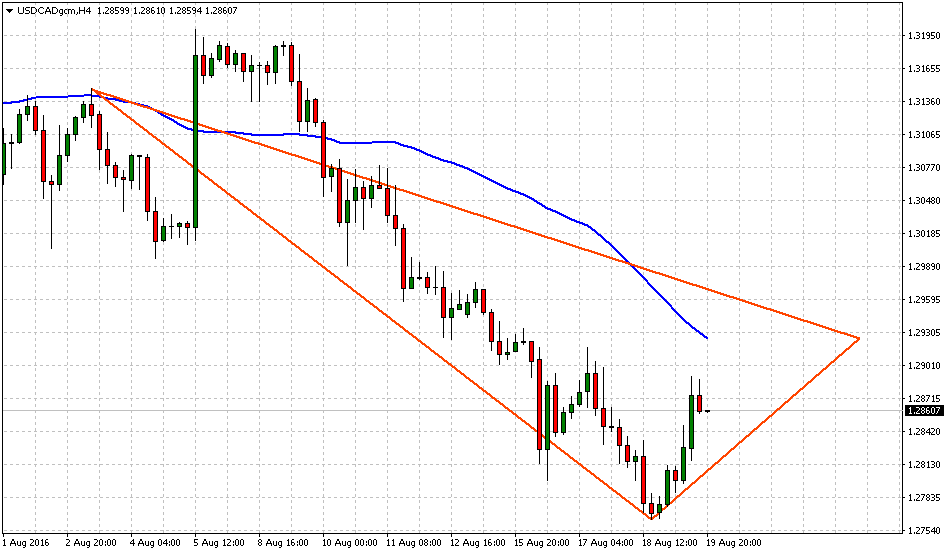
Short-term low at 1.27638 makes the price the next support level to break in the event Bears want to make a comeback to this action. Taking my shot at drawing charts that anyone can easily understand, you see the 50 SMA offering resistance somewhere around 1.29247 before it has any opportunity to continue towards the upside range inside the ascending triangle.
Canadian Dollar trades +440 pips from resistance to bottom
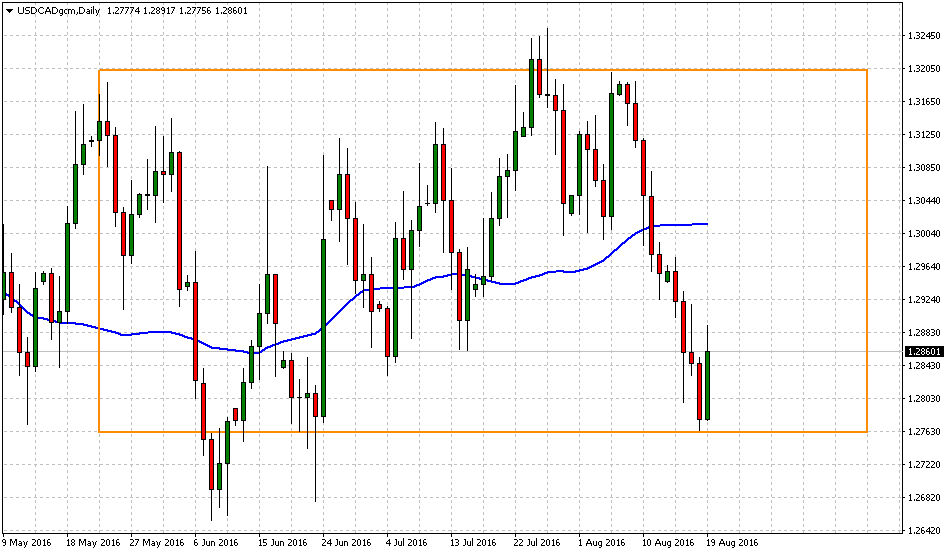
Let’s take a look at the daily chart; the story is no different since the beginning of May where the USDCAD started trading sideways what we may consider a “predictable” range was selling resistance the closest to 1.3100s level and vice-versa buying support as soon as prices traded below 1.27806.
Canada’s CPI indicates the Bank of Canada may need more rate cuts
There is some evidence based on yesterday’s data to drive markets to another assumption; the Bank of Canada may need to cut rates a bit more to boost consumers’ activity.
If we both go over the data these are the facts:
- Retail Sales ex Autos is below consensus 0.3% and previous 0.9% to tick (0.8%). Yes, that’s a negative reading.
- Retail Sales (MoM) Month over Month, not too different because the result is below consensus 0.5% and previous 0.2% to tick another negative reading; (0.1%).
- Consumer Price Index (MoM), Month over Month, has no better outcome as it is below consensus (0.1%) and on top of that ticks another negative percentage; (0.2%). It’s no brainer to see USD/CAD closing yesterday’s NY session at 1.28747.
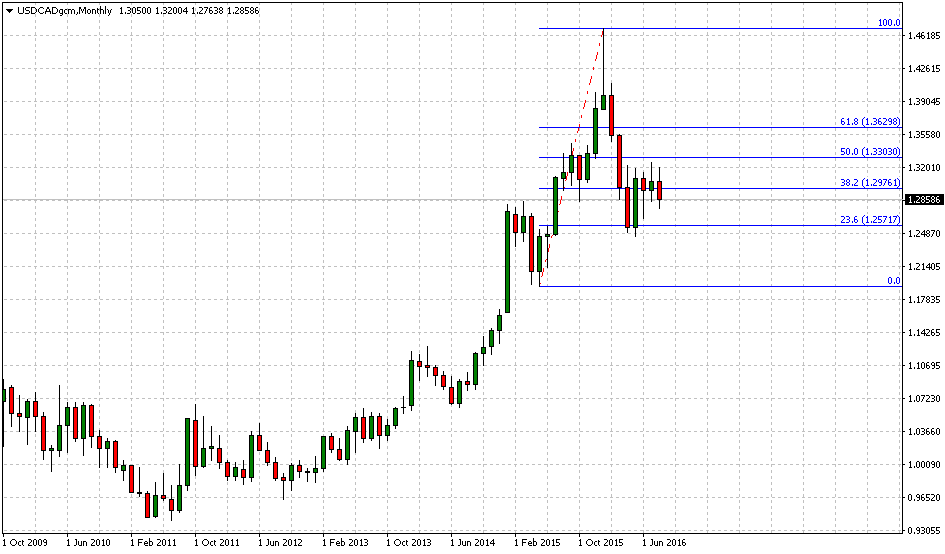
Then, I have one question: Is it going to be enough to give a break to the US dollar? Maybe, the main issue is to understand the current range, and we can appreciate that on the Monthly chart; just take a look.
Thanks to Fibonacci, another technical tool to determine expected ranges, I can pick the expected support somewhere around 1.25717 which represents the 23.6% however, close to 38.6% this pair can battle another resistance at 1.29761.
If you were to take a position which one would, that be? Short-term I am going to keep targeting 1.30205 to exit my long positions because as you can see on the monthly chart over the last five months, the resistance zone 1.31506 – 1.31802 has been rewarding short sellers with +300 pips in three different scenarios.
As usual trade Risk, place your stops and don’t adjust them!
José Ricaurte Jaén is a professional trader and Guest Editor / community manager for tradersdna and its forum. With a Project Management Certification from FSU – Panama, José develops regularly in-house automated strategies for active traders and “know how” practices to maximize algo-trading opportunities. José’s background experience is in trading and investing, international management, marketing / communications, web, publishing and content working in initiatives with financial companies and non-profit organizations.
He has been working as senior Sales Trader of Guardian Trust FX, where he creates and manages multiple trading strategies for private and institutional investors. He worked also with FXStreet, FXDD Malta, ILQ, Saxo Bank, Markets.com and AVA FX as money manager and introducing broker.
Recently José Ricaurte has been creating, and co-managing a new trading academy in #LATAM.
During 2008 and 2012, he managed web / online marketing global plan of action for broker dealers in Panama. He created unique content and trading ideas for regional newspaper like Capital Financiero (Panamá), La República (Costa Rica), Sala de Inversión América (Latinoamérica) and co-developed financial TV segments with Capital TV.
He is a guest lecturer at Universidad Latina and Universidad Interamericana de Panamá an active speaker in conferences and other educational events and workshops in the region. José Ricaurte worked and collaborated with people such as Dustin Pass, Tom Flora, Orion Trust Services (Belize) and Principia Financial Group.


 and CPI (MoM) delivered below-expected results.)