First off, our Forex Outlook starts taking a look at our news calendar for the day today. Fairly light for the day today. We have some bank holidays in effect. Switzerland bank holiday. French bank holiday. German bank holiday. So, that would likely cause some muted market movements on the EUR and the CHF pairs, but we definitely could see some movement based on US news. We do have some Empire Manufacturing data coming up at 8:30 AM Eastern US time today. Other than that, relatively light for the US trading session.
After the US trading session, during the London session, we do have some news out of Australia and New Zealand that could impact those currency pairs reviewed during this forex outlook.
All right, getting started here on the US Dollar versus the Swiss Franc [USDCHF]. We’re taking a look at the daily time frame first. We have been studying this downtrend channel between the two red trend lines for quite a long time. Most importantly, in the recent market movement, we’ve seen some upside momentum within the channel, and we’re getting very close to the top of that channel. That’s important because the closer it gets, the more potential we have for resistance. Not a guarantee that it won’t continue to go higher, but the very likelihood of resistance as we approach especially the 0.9800, that round handle as it gets just about 40 to 45 pips higher than the current market and we get closer towards that red trend line.
Let’s go ahead and zoom it in a couple of times here and you could see there’s the red trend line. There’s the 0.9800-level right there highlighted in orange. We’ve seen historical support and resistance along that 0.9800-level before, so it’s likely we would look for some resistance in there again today. We also have the 100-period simple moving average coming into play just above there into the 0.9830 or so level as it touches just above the orange-shaded area.
Indeed, if we’re going to see some continuation of the upside momentum, we need it to break through there before it goes higher. Right now that becomes our resistance. The yellow zone will be our support for the day today. That’s 0.9750, down to 0.9720. What we’re looking for is historical price action. We could see resistance here. Resistance here. So, it has been. Even here last week, we saw resistance, and now we’re challenging just above it. If it holds and stays above 0.9750, I think 0.9800 becomes our clear viewed target for the USDCHF.
Take it down to the four-hour timeframe. And as we look at it here on the four-hour, it’s not too hard to see we see the market push through 0.9750 and now sitting on top of it as support. So, as long as it stays above there, I think we’re looking for 0.9800. There’s nothing really to change the market attitude. We do have that empire state manufacturing at 8:30 AM today for the US, but other than that, no information out of Europe that would likely change, and Switzerland that would likely change, the attitude for this currency pair. Let’s look for it to head to back up towards 0.9800 at least for the day today, looking for opportunities on dips into support.
Let’s take it on over to the EURUSD. Similar situation. Just flip it upside down. Over the past several months, we have been studying this range. We go all the way back to January of 2015. We have been inside this red box, and we’re at the very top of the range, the upper part of that red box for the past several weeks. Let’s go ahead and take it back down to the daily timeframe. We see it touch there into 1.1500. A couple of weeks ago, we took a sell up there at 1.1500, and we were able to capture profit on the way down. I think we still want to focus in on that until we see the market change its attitude and start working its way back higher again.
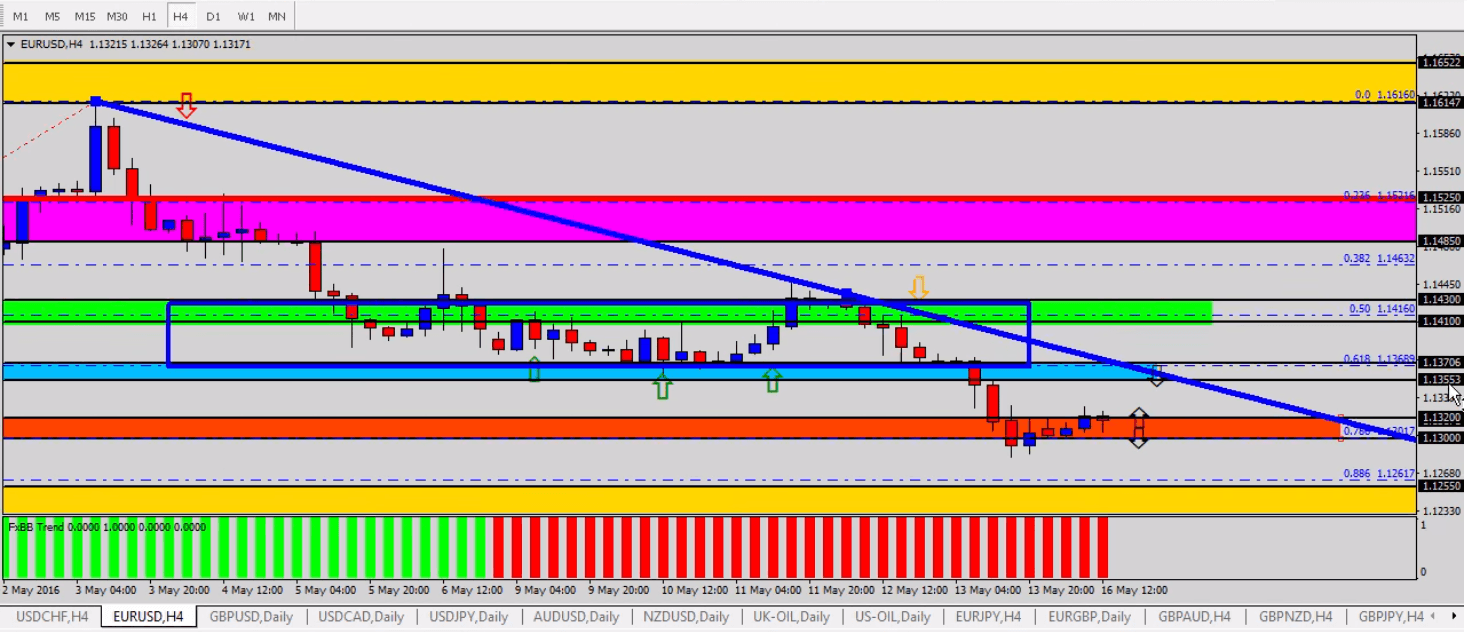
Zoom it in again a couple of times here on the daily timeframe. We clearly see that over the past several days, a couple of weeks now, we’ve been in a downtrend mode here for this currency pair. So, I think that’s still the direction we want to focus our efforts on that strategy. Selling resistance or breaks through support. Let’s go ahead and look for it to rally back towards the 1.1350-level to become a selling opportunity, or it either does that or breaks through the 1.1300-level. So, if we’re going to go short in the direction of the current trend, current momentum for the past two weeks, we sell rallies to the blue zone or the breakouts underneath the orange area. Then there’s no real reason to buy it yet until we see some change in attitude for the market.
Let’s take it down to the four-hour timeframe, and again, we see the congestion here in the orange zone. Push back above that orange-shaded area – let’s call it 1.1320 -, we’ll likely look for it to head back up here. 1.1350 to 1.1370, the blue-shaded area as our resistance. If it doesn’t get up there and breaks underneath 1.1300, I think we’re looking for just the next level lower, which would be the 1.1250, 1.1225-level, the yellow-shaded area at the very bottom of the chart. So, watching really for a breakout of this orange zone today for the EURUSD.
Taking a move over to the GBPUSD. I think this becomes an opportunity for the day today here on this currency pair. We have been studying, of course, the uptrend, the rise here for this currency pair along the blue trend line. We saw resistance towards the longer-term red trend line. It starts working its way back down. We have begun selling a couple of weeks ago into the 1.4500-level and many traders able to take profit on those shorts from 1.4500. Now we’re underneath 1.4400. Last Friday, we broke back underneath the 1.4400-level. Now we’re underneath it as resistance in a similar fashion that we looked at here into 1.4500 just a couple of weeks ago.
Let’s take it down to the four-hour timeframe and take a look at the similarities. It was in the orange zone. Broke underneath it. Used it as resistance here and this area up here at the orange-shaded area, underneath the black box. Then it fell. Rallied. Found strength. Now we’re underneath. So, I think as long as it’s within and underneath this blue zone, this is our opportunity for the day today. Our risk is apparent that if it breaks back above the blue zone, we’re looking for it to go back up again.
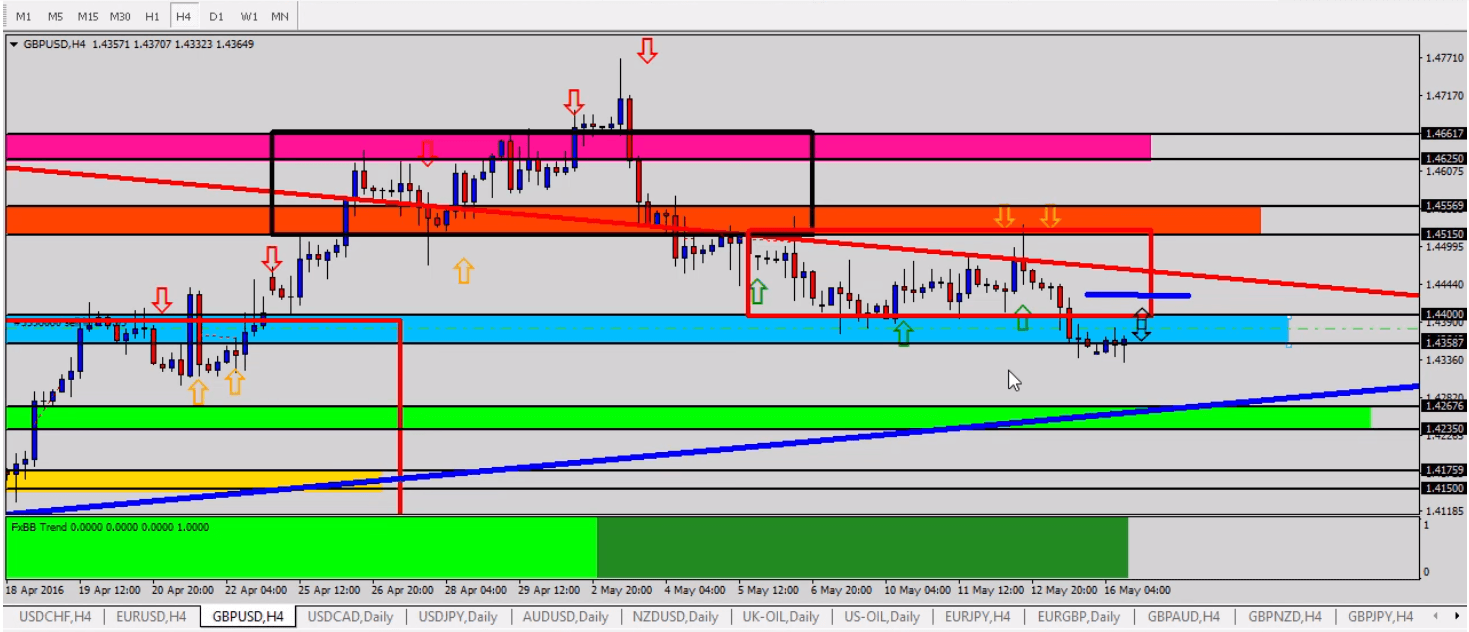
So, selling opportunities between the 1.4360 and 1.4400-level. I put a sell right at 1.4380. It’s about the medium point of that blue-shaded area. That way it gives me a little bit lower risk. I know what my risk is. It’s probably up there closer towards the 1.4440 or so level, where that blue line is. So, my risk is up there around 1.4440. My entry is around 1.4380, underneath 1.4400, looking for it to go back down towards the green-shaded area. Status quo is the downtrend and the momentum we’ve seen in that short side for the GBPUSD for the past couple of weeks.
So, just in a similar fashion of selling the orange zone, we’re now selling the blue zone, looking to target the next lower level into the mid to low-1.4200s for the GBPUSD forex outlook.
Source: Forex Traders Daily
José Ricaurte Jaén is a professional trader and Guest Editor / community manager for tradersdna and its forum. With a Project Management Certification from FSU – Panama, José develops regularly in-house automated strategies for active traders and “know how” practices to maximize algo-trading opportunities. José’s background experience is in trading and investing, international management, marketing / communications, web, publishing and content working in initiatives with financial companies and non-profit organizations.
He has been working as senior Sales Trader of Guardian Trust FX, where he creates and manages multiple trading strategies for private and institutional investors. He worked also with FXStreet, FXDD Malta, ILQ, Saxo Bank, Markets.com and AVA FX as money manager and introducing broker.
Recently José Ricaurte has been creating, and co-managing a new trading academy in #LATAM.
During 2008 and 2012, he managed web / online marketing global plan of action for broker dealers in Panama. He created unique content and trading ideas for regional newspaper like Capital Financiero (Panamá), La República (Costa Rica), Sala de Inversión América (Latinoamérica) and co-developed financial TV segments with Capital TV.
He is a guest lecturer at Universidad Latina and Universidad Interamericana de Panamá an active speaker in conferences and other educational events and workshops in the region. José Ricaurte worked and collaborated with people such as Dustin Pass, Tom Flora, Orion Trust Services (Belize) and Principia Financial Group.


