


Double tops and double bottoms are classic reversal patterns, and they are especially common in charts with shorter time frames. However, you need to be able to distinguish between a genuine reversal pattern and something that just expresses the shakiness of the market. This can be a particular problem in charts with very short time frames, such as an hour or less, as market volatility can mask the true movement of price action at this level of magnification.
As a powerful reversal pattern, double tops/bottoms are something that traders are always on the lookout for. However, this can be a double-edged sword, because the price can often give the impression that a double-top/bottom is being formed only for the supposed resistance/support line to be swiftly broken. There are, thankfully, many things that a trader can do in order to help them to distinguish a genuine reversal rather than a fake double top/bottom.
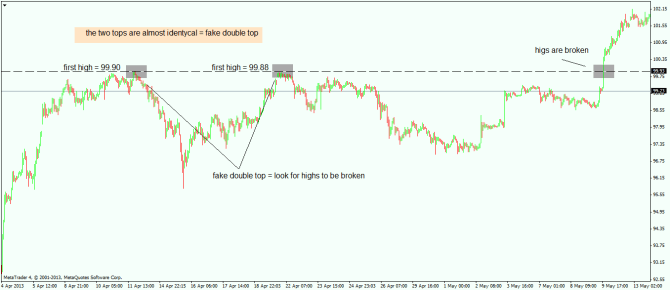
For starters, it’s worth mentioning that a double top/bottom refers to the area in which price reverses from, and this can vary from tens of pips to hundreds depending on the time frame. So, when price action is forming a possible double top/bottom and the price for the two possible tops/bottoms are very close to one another, then the chances are that the pattern is fake and the price will break through those levels.
For example, last year the USD/JPY broke the 100 level. In the following chart, you can see the price is heading towards the 100 level, hitting 99.90 before sharply reversing. Then, the price heads back up to almost exactly the same point – 99.88 – before again reversing sharply. When the two tops are so close, to the point of being nearly identical, this is a sign of a fake double top and that the highs will then be broken, as happened in this case.
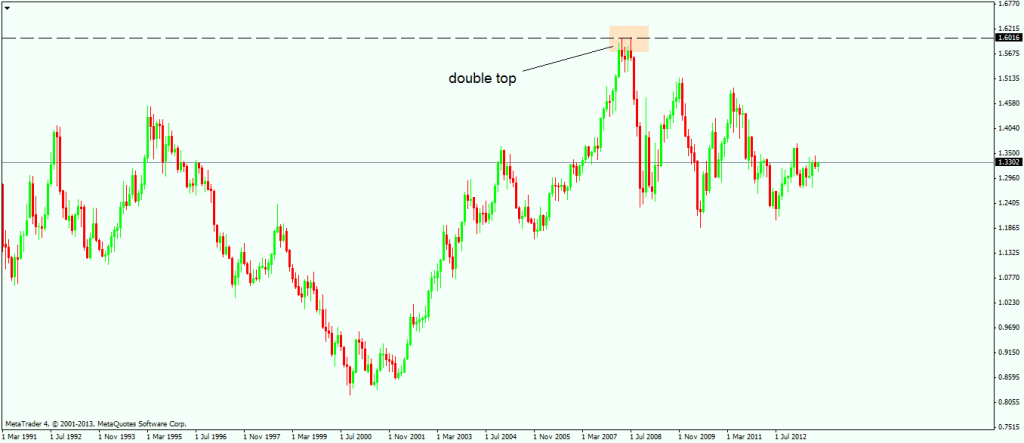
Another thing to look out for is the time between the two possible tops or bottoms. The longer the time between them, the more chance it has of being a fake move, and conversely, the shorter the time between them (up to a point) the more likely it is that you are seeing a real reversal. An example of this can be seen in the EUR/USD monthly chart from 2008 when the price moved above the 1.60 level. The fact that the time between the two tops is short indicates a real reversal in progress, and as we can see, this is what transpired.
So while it remains true that double tops/bottoms can be powerful reversal patterns, it’s important to be able to tell with some degree of accuracy which ones are real, and which are fake. Because they seem to form so often, it can be easy to get caught out, but if you can identify them properly, you can unlock huge profit opportunities.
Tradersdna is a leading digital and social media platform for traders and investors. Tradersdna offers premiere resources for trading and investing education, digital resources for personal finance, market analysis and free trading guides. More about TradersDNA Features: What Does It Take to Become an Aggressive Trader? | Everything You Need to Know About White Label Trading Software | Advantages of Automated Forex Trading


