


Pivot points are one of the oldest technical analysis tools in existence, and remain one of the most popular methods for determining key levels such as support and resistance, as well as the future price direction.
Before the advent of screen trading, floor traders at stock exchanges didn’t have the vast range of charts and technical indicators that they can now access, and had to make do with a few calculations based on the previous day’s price action.
At the start of every trading day, floor traders would calculate a pivot point for the current trading day based on the previous day’s high, low, and closing price. They would then use this pivot point to calculate two support levels and two resistance levels to assist their trading throughout the day.
Although pivot points have since been joined by a huge range of other technical indicators, they remain one of the most reliable methods for predicting major turning points in the market. Here, we’re going to show you how to calculate your own pivot points, and how to interpret your findings.
Examples Across Different Time Frames
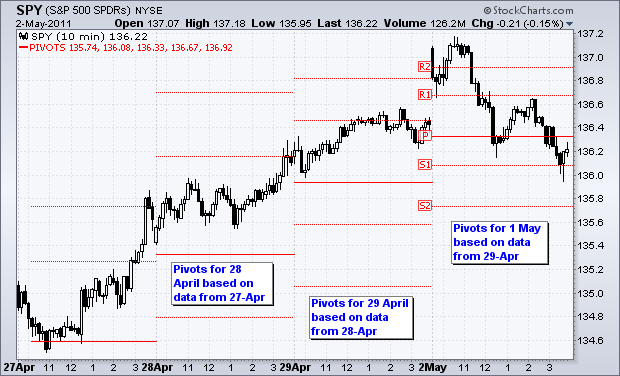
For very short time frames, eg 1, 5, 10, and 15 minutes, you would use pivot points based on the previous day’s high, low and close. Once they have been set, they do not change for the remainder of the day.
Source: Stockcharts.com
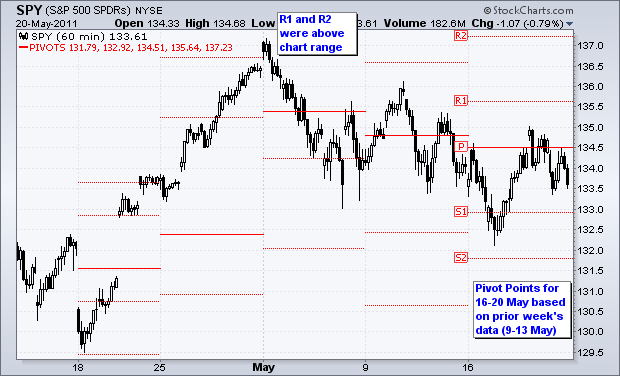
For time frames of thirty and sixty minutes, you would use the high, low, and close from the previous week. These are set at the start of the week and remain unchanged until new pivot points are calculated at the end of that week.
Source: Stockcharts.com
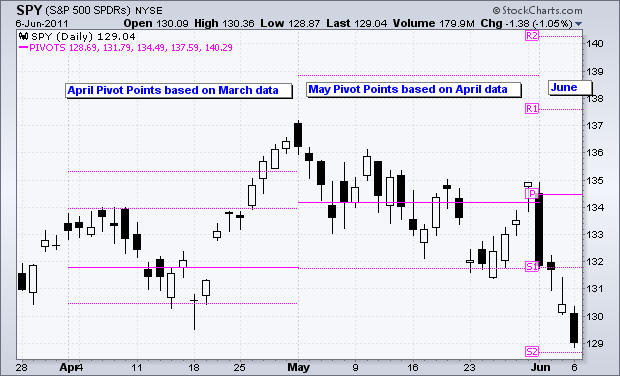
For daily charts, the pivot points are calculated using the data from the previous month. These are calculated on the first of the month and remain fixed for the whole month. For example, pivot points calculated on 1st March would be based on the high, low, and close for February, and would remain in place until the 1st of April.
Weekly and monthly charts use pivot points based on the data for the previous year, in much the same fashion as the examples given above.
Different Types of Pivot Points
There are several different ways to calculate pivot points, but we have outlined the three most popular types – Standard, Fibonacci, and Denmark – here, with instructions on how to calculate them. There is no single ‘best’ type of pivot point, as they all have their uses. It all depends on your trading style and strategy, and also the asset classes that you are trading. That’s why it’s worth trying them all out, and comparing the results, to see which ones give you the best results in certain situations.
It’s important to note that these all provide different quantities of support and resistance lines, with Denmark pivot points generating just one set, standard pivot points generating two sets, and Fibonacci pivot points generating three. In the examples that follow, we shall be using standard pivot points to demonstrate the basic principles, but the process is similar for the other types. Most charting programs will allow you to overlay all three types for the purposes of comparison.
Calculating Standard Pivot Points
These are the most basic type of pivot points, and are also the most commonly used. Standard Pivot Points begin with a base pivot point, which is a simple average of the high, low, and closing price. This pivot point is shown as a solid line between the support and resistance levels derived from this pivot point.
Here are the calculations required for standard pivot points:
Pivot Point (P) = (High + Low + Close)/3
Support 1 (S1) = (P x 2) – High
Support 2 (S2) = P – (High – Low)
Resistance 1 (R1) = (P x 2) – Low
Resistance 2 (R2) = P + (High – Low)
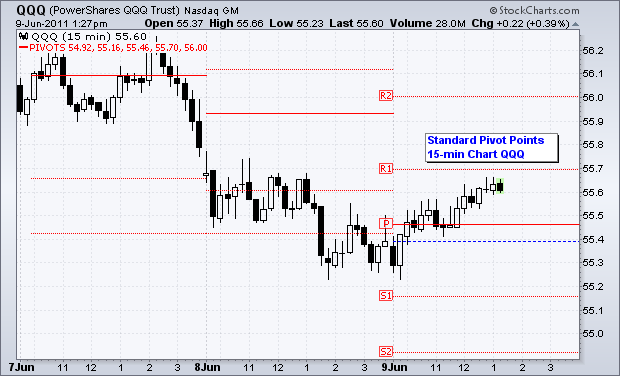
Here is an example of a 15-minute chart with standard pivot points on it. At the beginning of the the trading day on June 9th, the pivot point is in the middle, the support level is below, and the resistance level is above. These will remain constant throughout the day.
Source: Stockcharts.com
Calculating Fibonacci Pivot Points
Fibonacci Pivot Points are exactly the same as standard pivot points, but use different calculations to work out the support and resistance levels. Using the base pivot point, which is again a simple average of the relevant high, low, and close, Fibonacci multiples of the high-low differential are added to form resistance levels and subtracted to form support levels.
Pivot Point (P) = (High + Low + Close)/3
Support 1 (S1) = P – {.382 * (High – Low)}
Support 2 (S2) = P – {.618 * (High – Low)}
Support 3 (S3) = P – {1 * (High – Low)}
Resistance 1 (R1) = P + {.382 * (High – Low)}
Resistance 2 (R2) = P + {.618 * (High – Low)}
Resistance 3 (R3) = P + {1 * (High – Low)}
In the chart below, R1 and S1 are based on 38.2%. R2 and S2 are based on 61.8%. and R3 and S3 are based on 100%.
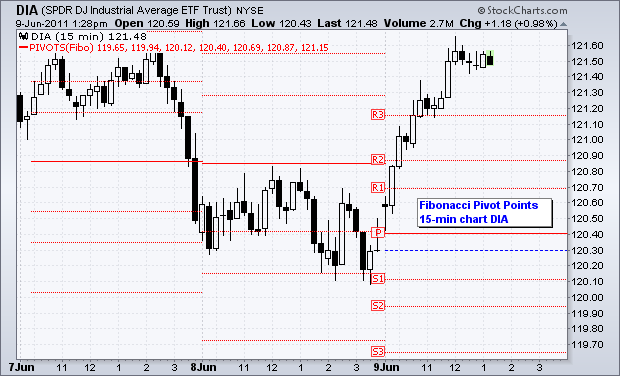
Source: Stockcharts.com
Calculating Demark Pivot Points
These use a different formula for calculating the base, and the formulas for calculating support and resistance are also different. Demark Pivot Points are conditional on the relationship between the opening and closing prices, as follows:
If Close < Open, then X = High + (2 x Low) + Close If Close > Open, then X = (2 x High) + Low + Close
If Close = Open, then X = High + Low + (2 x Close)
Pivot Point (P) = X/4
Support 1 (S1) = X/2 – High
Resistance 1 (R1) = X/2 – Low
Denmark Pivot Points only have one support and one resistance level, as you can see in the chart below.
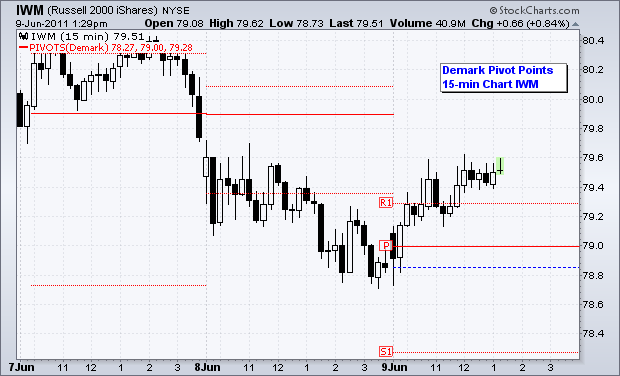
Source: Stockcharts.com
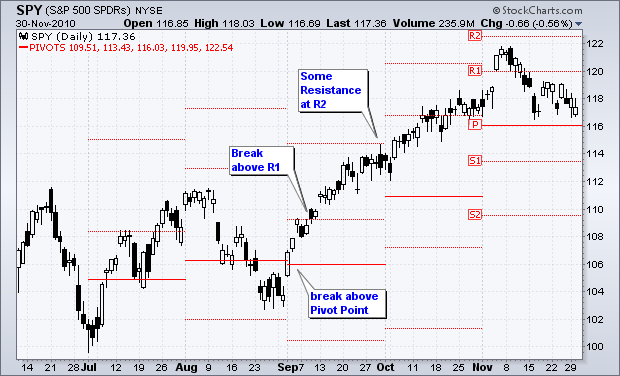
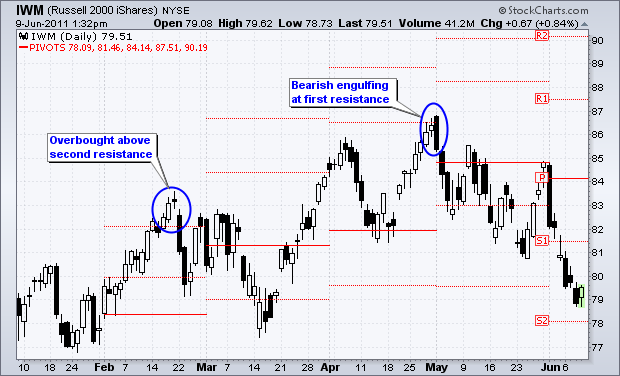
Understanding Pivot Points
Pivot points set the tone for price action across the time-frame being studied. Any move above the pivot point (the middle line marked ‘P’) is positive, suggesting strength with a target to the first resistance level. A move above the first resistance level suggests an even stronger move with a target to the second resistance level.
Source: Stockcharts.com
The same principle applies in reverse to downwards price action. A move below the Pivot Point suggests weakness with a target of the first support level. A move below the first support level suggests even greater weakness, with a target to the second support level.
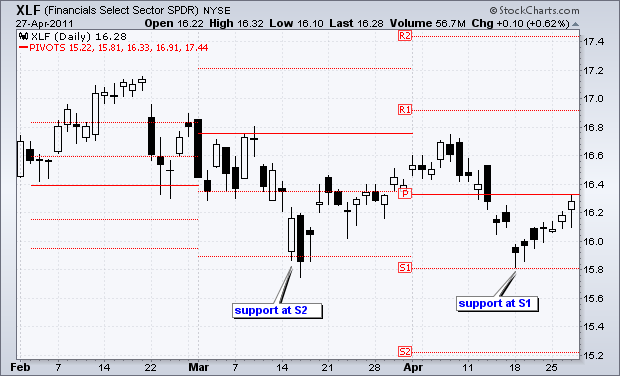
Support and Resistance Levels
The support and resistance levels derived from pivot points can be used in much the same way as normal support and resistance levels. When these levels come into play, you need to keep a keen eye on the price action as they can be quite accurate predictors of this. If prices decline to a support level and then firm, traders can keep an eye out for a successful test and then bounce off the support. A bullish chart pattern or indicator can also be used to confirm a bounce upwards from the support level. By the same token, if prices rise to the resistance level and then stall, traders should look for a bearish chart pattern or indicator to confirm a downturn from the resistance level.
Source: Stockcharts.com
You can use the second support and resistance levels to identify when assets are being overbought or oversold. If the price moves above the second resistance level, it shows strength, but also indicates that the asset may be overbought and that a pullback could be coming soon. Conversely, a move below the second support indicates weakness, but also suggests that the asset may be in an over-sold situation that could lead to a bounce.
Source: Stockcharts
Making Proper Use of Pivot Points
As we can see from the examples above, pivot points provide traders with a method for determining likely price direction and setting support and resistance levels to inform their trading decisions. While the market will often start above or below the pivot point, the support and resistance levels do not come into play until this central pivot point is crossed. Although they were originally designed to inform the short-term strategies of floor traders, they can be useful across a wide range of time frames.
One thing to bear in mind is that pivot points don’t tell the whole story, and as such need to be used in conjunction with other indicators in order to gain a more complete picture of the market. For example, a bearish candlestick reversal pattern could be used to confirm a reversal at the second resistance level. An upturn in MACD could confirm a successful support test, while a high reading on an RSI indicator could confirm that a breach of the second support indicates over-selling.
Tradersdna is a leading digital and social media platform for traders and investors. Tradersdna offers premiere resources for trading and investing education, digital resources for personal finance, market analysis and free trading guides. More about TradersDNA Features: What Does It Take to Become an Aggressive Trader? | Everything You Need to Know About White Label Trading Software | Advantages of Automated Forex Trading


