


In broad terms, an oscillator is anything that moves back and forth between two points – so at any time, it will be at some location between point A and point B. For example, the oscillating switch on a desk fan rotates the fan from one side to the other.
In trading terms, a technical indicator is either ‘on’ or ‘off’, signalling to buy or sell the asset or instrument being analysed, but it may sometimes be between these two points.
Examples of oscillating indicators include the Relative Strength Index (RSI), the Parabolic SAR, and the Stochastic indicator. These indicators are intended to signal the possibility of reversal after a trend has run out of steam and the price looks set to change direction.
In the chart below, we’ve put all three of these oscillators onto a GBP/USD daily chart. As you can see, all three of the indicators gave buy signals around the end of December, and if you had performed the recommended trade, you would have pocketed around 400 pips in profit.
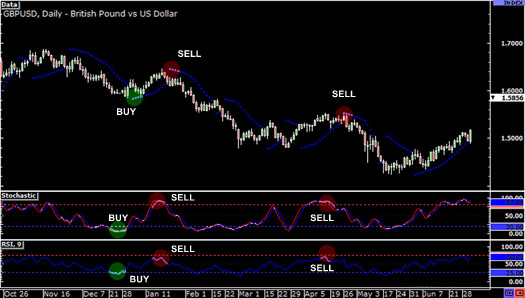
During late January, all three indicators gave sell signals, and again you would have made a big profit if you had shorted at that point. The same happened around mid-April.
However, like all indicators, they occasionally give false signals, as you can see in the chart below. For example, the Parabolic SAR was giving a sell signal in mid-February, while the Stochastic was giving a buy signal – and the RSI was giving no signal at all.
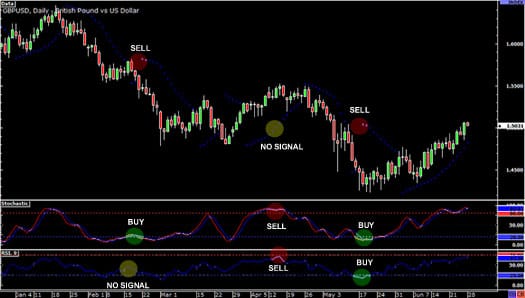
As you can see, there are a lot of false signals in the chart above. In April for instance, the Stochastic and the RSI gave sell signals but the Parabolic SAR didn’t give one. After that, the price kept increasing and you would have made a loss if you had followed the signals. You would have done the same had you acted on the buy signals from the Stochastic and RSI in mid-May and ignored the sell signal from the Parabolic SAR.
The reason why these indicators can conflict so often is that they are all calculated in a different way.
- The Relative Strength Index (RSI) uses the change from one closing price to the next.
- Stochastic is based on the high-to-low range of the time period (for example, every hour), but doesn’t account for changes from one time period to the next.
- Parabolic SAR has its own unique calculations that can further cause conflict.
Basically, oscillators only work on the assumption that a particular price movement always results in the same type of reversal, which of course is never the case. Although a leading indicator may be wrong, that doesn’t mean you should ignore it altogether. Basically, if you are getting mixed signals, then any trade that you make will be based almost purely on guesswork, so if the chart isn’t meeting all your criteria, it’s best to skip that trade and wait for the next opportunity.
Tradersdna is a leading digital and social media platform for traders and investors. Tradersdna offers premiere resources for trading and investing education, digital resources for personal finance, market analysis and free trading guides. More about TradersDNA Features: What Does It Take to Become an Aggressive Trader? | Everything You Need to Know About White Label Trading Software | Advantages of Automated Forex Trading


