
Cannaland Token (CNLT)
The live Cannaland Token price today is $0.306946 USD with a 24-hour trading volume of $32,862.31 USD. Cannaland Token is up 7.59% in the last 24 hours. The circulating supply is 22,500,000 CNLT coins.
CannaVerse Technologies, a strong advocate for marijuana and its medicinal uses, created Cannaland to leverage Web3 services and blockchain technology to usher cannabis into the virtual world. Cannaland is cultivating the world’s first cannabis-focused metaverse to achieve this goal. The grand vision for Cannaland: A one-stop, virtual platform for all things related to cannabis cultivation, extraction, manufacturing, distribution, retail sales and consumption.
Providing monetary infrastructure is the Cannaland Token (CNLT), which will act as the primary currency for transactions in its metaverse.

Bitcoin (BTC)
After a bearish December, Bitcoin began the first week of the year with a bullish run. It auctioned at $16,707. At mid-week, Bitcoin price showed a clear trend shift on a lower timeframe after its recent spike. Bitcoin price was ready to make its move. Bitcoin price triggered an uptrend after bouncing off the $16,624 support level.
This move produced a market structure shift when considering the recent higher high. While the bullish outlook was alive, confirmation of the uptrend arrived when BTC manages to flip $16,822, which was the highest volume traded level since November 5. Bitcoin attempt a move to $17,306 followed by the range high at $18,401 and the highest volume traded level for 2022 at $19,237.
Bitcoin price is likely to move higher
On January 5, Bitcoin price was putting forth optimistic signals as the peer-to-peer digital currency rose by 3% since 2023’s opening bell. The move north took place after the bulls established a higher pivot point at $16,333 on December 30, compared to the previous bearish attempt that was halted at $16,256 on December 19.
Bitcoin price auctioned at $16,854 on Friday, up 1% on the day after falling just $9 short of tagging the psychological $17,000 resistance. As January 4th’s market neared the final hour, the BTC price seemed poised to settle above the recently breached 21-day simple moving average (SMA) at $16,750.
In doing so, sidelined bulls reentered the market to challenge key levels within December’s trading range. Going into the end of the week, Bitcoin price presented trader’s an opportunity. Bitcoin price rose in stair-step fashion during the first week of the year, bolstering a 4% increase in market value since January 1’s opening price. The progressing uptrend ricocheted back and forth between the $16,500 and $16,990 zone. On Friday, January 6, the bulls pressed on further, expanding the uptrend into the $17,000 zone.
At the final hours of last week, Bitcoin price auctioned at $16,937 as day traders were quick to book profits at the psychological $17,000 marker. During the hike, the bulls successfully breached the 8-day exponential and 21-day simple moving averages, suggesting more uptrend gains could be had in the coming days.
If the market is genuinely bullish, the next target for bulls to aim for would be the December high of $18,387. The key monthly level lies parallel with the 50. % Fib level, extracted from a Fibonacci retracement tool surrounding November swing high at $21,480 and the 2022 low at $15,476. The target level creates possibility of a 9% rally from the current BTC price today.

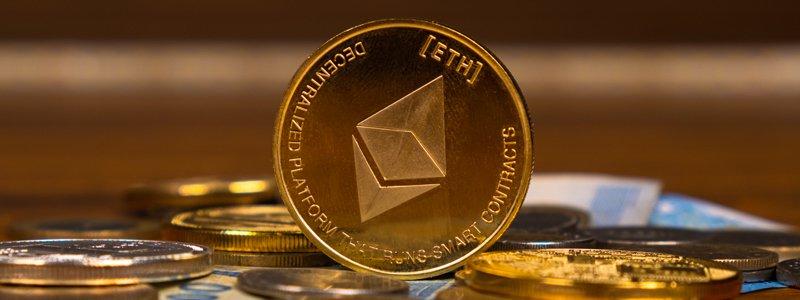
Ethereum (ETH)
Even though Ethereum price closed out in December with a 3% loss in market value, the new year has seen some impressive hike so far. Ethereum price traded at $1,216 on Monday, January 2. After finding support near the $1,100 zone in mid-December, the bulls produced an ascending trendline. The consolidation hovering directly above the supportive barrier suggests trouble for the 2022 low at $880.
At mid-week, Ethereum price had risen by 6% since the start of the new year. The bulls have produced a bullish engulfing candle back into October’s support zone, aiding two previous countertrend rallies. Like Bitcoin’s technicals, the decentralized smart-contract token hurdled both the 8-day exponential and 21-day simple moving averages during January 4th’s upward move.
As of Thursday, January 5, Ethereum price traded at $1,216. Analysts believe if the market is genuinely bullish, the bulls should be able to rally into the midpoint of October’s trading range at $1,400, resulting in an additional 12% gain.
Colin Wu, a Chinese journalist, recently shared details of a large order of 26,000 ETH put options with a strike price of $400, with an expiration date of June 30. The number of Ethereum validators is set to surpass 500,000 in 2023.

Ripple (XRP)
On January 2, the bears attempted to breach the 2022 low at $0.287 but fell short. XRP fell by 10%, producing a low of $0.30, but the price quickly rebounded into the $0.34 zone. Ripple price began the week auctioning at $0.345. The recent liquidation is an enticing bullish gesture.
Ripple price dug a lot lower than other altcoins on January 1 but its recovery since then has come along well. As XRP price traded around $0.348 on Tuesday, investors are expecting this trend to continue until it tags the $0.374 hurdle. Beyond this level, if the buying pressure continues to hold, the remittance token could retest the the equal highs at $0.397.
As of January 4, Ripple coils between the 8-day EMA and 21-day SMA, garnering 1.5% increase in market value since the start of the year. XRP price auctioned at $0.3485. Traders are focused on the recent swing high established at $0.3605. A second attempt to hurdle the barrier could be the move bulls have been waiting for. Key liquidity zones of interest would be the $0.37 and $0.4000 swing highs established on December 13 and 27, respectively. The bullish scenario would create the potential for a 14% rally from Ripple’s current market value.
XRP, the sixth largest cryptocurrency by market capitalization and the native token of the Ripple ecosystem is currently on track for a bullish breakout. The altcoin is targeting the $0.3566 level after breaking out of the symmetrical triangle formation. XRP bulls believe a breakout from the $0.3423 level is likely as the altcoin trades close to the upper trendline forming the symmetrical triangle. As XRP price moves between two converging lines, experts await a bullish breakout in the altcoin.
With a market capitalization of $17.3 billion, XRP bulls are on track to drive the altcoin higher. Large wallet investors on the Ripple network started accumulating the altcoin through the recent dip in its price. After scooping up XRP tokens, whales are likely to increase their activity and engage in profit-taking once the remittance coin hits a local high.

Cardano (ADA)
ADA closed December’s auction at a 22% loss of market value on the month, more than five times of Bitcoin’s 4% decline. As of January 2, the smart-contract token is up 3% since breaching the $0.24 price zone. Three days of bullish price action were optimistic as Cardano price auctioned at $0.253. The pullback finds resistance at Cardano’s previous support zone during December’s 22% downswing. Additionally, the bulls are finding resistance from the 21-day simple moving average.
By mid-week, Cardano price had risen by almost 6%, bringing the price to $0.266. ADA could rise to $0.300 if buyers sustain the bullish momentum. Cardano price was able to revive itself after forming two-year lows towards the end of 2022, registering a good start to 2023. The third-generation cryptocurrency still has a shot at initiating recovery, provided it can breach through its almost month-long resistance level.
Cardano price slipped to $0.240 before the beginning of the new year after falling by more than 16% mid-December. Since then, ADA has managed to recover slightly, bringing the trading price of the altcoin to $0.266 after a 5.93% rise noted in the last 24 hours.
On Friday, December 6, Cardano price auctioned at $0.2693. The bulls successfully breached both the 8-day exponential and 21-day simple moving averages, which suggests Cardano has more upside potential. The move north could rally as high as the 61.8% Fib level near $0.2900 without voiding the larger bearish narrative. Thus, the correction could yield an additional 8% before bears attempt to push the downtrend further.
Cardano price has surpassed its two Exponential Moving Averages at 50-day and 200-day, implying ADA is on track to the $0.4180 bullish target. The altcoin’s price is in an ascending channel, and the Relative Strength Index (RSI), a momentum indicator, is 77.90, implying the asset is overbought.

Solana (SOL)
Solana price shot up by 13% in the last 24 hours after dipping below $10 around New Year’s Eve. Solana price was charting its own route, painting green, despite the broader market noting no such reaction. Solana price noted a sudden increase in its value as the asset traded at $11.16. The 13% rise observed came after the altcoin registered an almost 16% dip towards the end of 2022.
Recovering from the same, Solana price shot up from the low of $7.96 to trade at $11.16 on Tuesday, January 3. The cryptocurrency was very close to flipping the 30-day Exponential Moving Average resistance into support.
As of Wednesday, last week, Solana price had rallied by almost 35% since January 1. Solana price showed strong bullish price action in recent days. The uptrend looks likely to continue unless the bears alter the narrative based on the factors written below. Solana price has pulled off applaudable market behavior, returning 35% of lost funds to the hands of investors since January 1. While most cryptocurrencies have witnessed little to no gains, the smart-contract token has become a true outperformer, forcing traders to consider joining the market for more uptrend gains.
On Wednesday, Solana price traded at $13.21. On December 29, the Solana token briefly fell into an $8 low, which was quickly scooped up by sidelined bulls and catalyzed the current rally. As of January 3, the bulls successfully breached both the 8-day exponential moving average (EMA) and the 21-day simple moving average (SMA), deeming the current uptrend move genuine enough to take a risk at higher targets.
At the close of the week, Solana flipped the narrative from dead project to 22% daily gains. Solana has flipped the narrative and recovered from a “dead project” to a proof-of-stake blockchain with high development activity and consistent social dominance and volume. The altcoin observed a huge spike in its trade volume after a 22% decoupling from the crypto market.
Digital Asset Insights
Digital Asset Insights #99
first appeared on trademakers.
The post Digital Asset Insights Digital Asset Insights #99 first appeared on JP Fund Services.
The post Digital Asset Insights Digital Asset Insights #99 appeared first on JP Fund Services.


