Good and Bad News for Crypto Traders: time to leverage the bullish trends of your favorite digital assets by staying informed with market behavior and incisive predictions.

BITCOIN (BTC)
At the opening of the week, Bitcoin started a fresh decline after it failed to clear the $40,000 resistance zone. The price traded below $39,500 and the 100 hourly simple moving average. The price even traded below the $39,200 support level. A low was formed near $38,200 as the price consolidated losses on April 25.
However, on April 26, Bitcoin started a major recovery wave and climbed above $40,000 resistance. There was a break above a major bearish trend line with resistance near $39,500 on the hourly chart of the BTC/USD pair. The pair eyed more upsides above the $40,500 and $40,850 resistance levels. A low was formed near $38,200 and the price started a major increase. The price climbed higher above the $39,200 and $39,500 resistance levels. There was a move above the 23.6% Fib retracement level of the key decline from the $42,950 swing high to the $38,200 low.
On April 27, Bitcoin failed to gain a pace above $40,700 and declined against the US Dollar. BTC traded to a new weekly low as it struggled to climb above $39,200 and started afresh decline after it failed to clear the key $40,700 resistance zone. The price was back below $39,000. There was a break below a connecting bullish trend line with support near $39,500 on the hourly chart of the BTC/USD pair. The pair could correct higher as the price declined sharply. A high was formed near $40,776 and the price reacted to the downside. There was a break below a connecting bullish trend line with support near $39,500 on the hourly chart of the BTC/USD pair. Bitcoin gained 2.5% in the last 24 hours of Thursday, last week and traded near the immediate resistance level of $40k
Bitcoin tried its hand at $40,000 on Friday but was quickly stopped in its tracks and now sits below it. The enhanced volatility in the crypto market continued in the last 24 hours of the week. As a result, the asset fell by over $3,000 in hours and plummeted below $38,000 for the first time since March 15. It reacted somewhat positively to this price decline and bounced off to just under $40,000. It went even further during Saturday’s trading day and spiked above that coveted level. However, that was a short-lived adventure as it fell below it almost immediately.

ETHEREUM (ETH)
At the beginning of the week, Ethereum’s bounce saw it touch intraday highs near $3,000. Bitcoin (BTC) and Ethereum (ETH), the ‘big boys’ of the crypto market with a combined market capitalization of nearly $1.2 trillion (the total crypto market capitalization was $1.9 trillion on Monday, April 25.
On April 25, the crypto market continued its sharp correction, in correspondence with the global markets. Ethereum lost about 10% and started the first day of the week in the red. Earlier on Monday, ETH recorded its lowest level since March 18, a five-week low. The price was on top of the horizontal support at $2800, the first critical support level on the daily timeframe.
Before the end of the day, the Ethereum price was seen recovering from the lower boundary of the channel as the coin moved to reclaim the resistance level of $3000. The price of the coin exchanged hands at the $2924 level as the bulls were making effort to push it to the upside.
On the 26th of May, the Ethereum price was seen recovering from the lower boundary of the channel as the coin moved to reclaim the resistance level of $3000. The price of the coin was changing hands at the $2924 level, and the bulls were making an effort to push it to the upside.
By the 28th of May, Ethereum started a recovery wave above the $2,840 level against the US Dollar. ETH faced a major challenge near $2,905 and the 100 hourly SMA. Ethereum started a decent recovery wave above the $2,840 and $2,850 levels even though the price was still below $2,900 and the 100 hourly simple moving average. Ethereum traded as low as $2,766 before it started a recovery wave. ETH was able to settle above the $2,800 resistance zone.
There was a move above the $2,840 and $2,850 resistance levels. Ether even climbed above the 23.6% Fib retracement level of the key drop from the $3,040 swing high to the $2,766 low. It was still below $2,900 and the 100 hourly simple moving average. On the upside, initial resistance was seen near the $2,900 level.
Going into the new week, ETH/USD is likely to refresh to the upside as the coin currently trades at $2806 with a bullish crossover and trend intraday. The Ethereum price is likely to stay above 9-day and 21-day moving averages as the higher resistance in April comes at the $3000 resistance level.

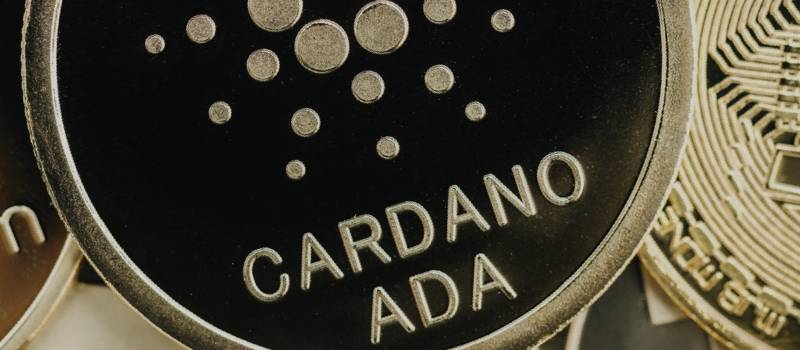
CARDANO (ADA)
At the opening of the week, Cardano price woes seem to be increasing since its all-time high in September 2021. The ADA bears also pushed ADA below the buy zone, suggesting that the bears are in control. Cardano’s price pulled a 180 as it undoes nearly all the gains witnessed since March 14. This downswing adds to ADA’s woes that have been ongoing since its all-time high at $3.10 on September 2, 2021.
On Tuesday, 26 April 2022, Cardano price saw an attempt from bulls to reverse the price trend which failed. ADA price was again down for the day and was set to eke out more losses. Cardano’s (ADA) price was still under pressure from its rejection by the 55-day Simple Moving Average at $0.97 on April 20. Since then, ADA price has been trading lower as more bearish pressure mounts and dollar strength adds a double weight to the downtrend.
By the 27th of April, Cardano price continued the downslide path as the bears printed a bearish engulfing through a significant Fibonacci level. Bulls still involved are at high risk for a “sweep the lows” capitulation event… Cardano’s price was disappointing for traders last this week as the price action continues to see bearish force. On Wednesday, the ADA price saw a significant sell-off into the $0.82 level, now the lowest price point for April.
On April 29, 2022, Cardano’s price seemed to be hemorrhaging nonstop since its all-time high in September 2021. Unlike other altcoins, ADA has not sneaked in any substantial rallies and has been on a steady downtrend. Cardano’s price rallied 60% between March 7 and 29 to set a range, extending from $0.776 to $1.240. On both sides of the range, ADA has created equal swing points, which reveals the presence of liquidity.

RIPPLE (XRP)
At the opening of the week, Ripple price took another U-turn and reentered the buy zone, extending from $0.62 to $0.68. This move is likely to push the XRP price to retest the 70.5% retracement level at $0.657 before triggering an uptrend.
The Ripple price traded at $0.67, retesting the trend line below the 10% rally candle seen on April 13-15. XRP price was still bullish based on the sellers’ volume tapering off as the price traded halfway through a parallel channel at $0.67.
However, on 27 May 2022, Ripple price had driven lower into the $0.626 to $0.689 buy zone, painting a similar trend seen across Ethereum and Bitcoin. Regardless, the remittance token seems to be holding its own around the $0.626 barrier.
When the trading session of April 29 came to an end, Ripple’s (XRP) price could not recover from the massive drop on Monday and Tuesday. XRP price was still looking for support at $0.6264, where it could easily fall to, as the Relative Strength Index (RSI) was flat lining and trading in the oversold area.
The Ripple price was set to pop higher over the weekend as, during the trading week, too many tail risks and noise in global markets make it almost impossible for bulls to recover from the incurred setback on Monday and Tuesday. With that move, the XRP price was seeking support again at $0.6264, a historic pivotal level playing its role for the third time since March. With the RSI in the oversold area, it looks like the party is over for bears for now, and XRP price will see profit-taking from that side, with buy-side volume picking up.
ALTCOINS

SOLANA (SOL)
On Monday, 25 May 2022, Solana price failed to find support at the 50-day moving average. SOL price was submerged below the parallel channel median line. The bulls failed to hold support following the breakout on March 30th. Following the first sell-off, the bears managed to push the price through the parallel channel median line and the 50-day moving average.
During the trading session of April 27, SOL/USD was seen moving to cross above the 9-day moving average to begin the bullish movement within the channel. According to the daily chart, the Solana price was likely to shoot to the upside as the technical indicator Relative Strength Index (14) moved to cross above 50-level.
More so, on Thursday, the sixth-largest alt was trading at $99.5, up by 0.5% in the day’s trade. Solana’s (SOL) price saw the $95-handle being well defended by bulls for the fourth time. The zone between $95 and $85 remained an unchartered territory for April and shows the force of bulls willing to start an uptrend. The Solana blockchain was hit by the Metaplex Candy Machine bots that took SOL’s network down for nearly seven hours. The event had a negative impact on Solana’s price.

AVALANCHE (AVAX)
Avalanche was on the decline in the just concluded week. The price fell by 16.43% in 7 days and further declined by 2.81% on Saturday. In the first hour of the new week, it shrunk by 0.74%. It is currently exchanging hands at $57.30 per AVAX which is 60.81% below the all-time high of $146.22.

DOGECOIN (DOGE)
Unlike Avalanche, Dogecoin was on the rise last week. The price of Dogecoin rose by 2.07% in the last 8 days. There was a decline of 0.04% on Saturday and a further downtrend of 0.57% when the trading session of the new week resumed. It is currently traded at $0.1309 per DOGE which is the same as 82.31% below the all-time high of $0.74.

TETHER (USDT)
Tether, like most top cryptocurrencies, was on a slight decline last week. The price fell by 0.01% in seven days but remained almost unchanged in the last 24 hours of the week. Going into the new month, it has grown by 0.02% and it is currently sold at $1.0001 per USDT which is 18.02% below the all-time high of $1.22.

BINANCE (BUSD)
Binance USD experienced a bearish trend last week as it fell by 0.05% in 7 days. The price declined by 0.10% on Saturday and it is currently sold at $1.001 per BUSD, 9.82% below the all-time high of $1.11
The post <h5>Digital Asset Insights</h5> <h3>Digital Asset Insights #64</h3> appeared first on JP Fund Services.


