There have been some swings in the crypto market in the past seven days you should be aware of know as this week’s trading session commences. Some strong coins deranked as newer coins gained momentum.

BITCOIN (BTC)
Bitcoin began the week trading at $46,453 after soaring above the 9-day moving average on Sunday, 3 April 2022. But on Monday, April 4, the first crypto by market cap was rejected as it tries to reclaim the high area around its current levels. It faced a short-term downside price action when it exchanged hands at $45,500 with a 2% loss in 24 hours.
By 7 April, Bitcoin’s upward momentum had diminished significantly as it was down by 4.38%, hitting $43,495 during intraday trading. After hitting a yearly high in late March, Bitcoin was back at the $43k price mark. It traded at $43,367, a few hours before the coin went as low as $42,899 which is a 4% decline in a day and 8% downtrend in a week. Notably, Bitcoin had reached a Year-to-Date high of $48,159. Since the Bitcoin continuously remained north of $45k. the correction began on April 6, and within a few hours on April 7, the coin reached its lowest level since the last week of March.
Bitcoin’s recent performance has adversely impacted all the other major mainstream coins. As literally every single cryptocurrency among the top 20 is in a red zone. LUNA, SOL, DOGE, NEAR, and DOT emerged as the biggest losers in 34 hours.
The week was filled with intense volatility, but unfortunately, a lot of it was to the downside. On April 8, Bitcoin traded at around $43,800, down by 3.6% during the week. Taking advantage of the buyer’s inability to produce meaningful gains, bears pushed the price down, and by the next day, BTC was trading below $43,000 for a brief period. It managed to recover before the end of the day as it traded slightly below $44,000.
Bitcoin’s nosedive continued into the last 24 hours of the week and the asset slipped to a 17-day low of around $42,000. Most altcoins were also in the red, with the most losses coming from Terra, Solana, Avalanche, Cardano, and Dogecoin from the larger-cap ones.

ETHEREUM (ETH)
At the beginning of the week, Ethereum gained pace above the $3,500 resistance against the US Dollar and the 100 hourly simple moving average. Ethereum started a fresh increase after it cleared the $3,450 resistance. A key rising channel forming with support near $3,455 on the hourly chart of ETH/USD. The price even spiked above the $3,550 level and traded as high as $3,580. There was a move below the 23.6% Fib retracement level of the upward move from the $3,215 swing low to the $3,580 high.
Ethereum remained stable above the $3,400 level against the US Dollar on April 5. ETH bulls protected a downside break below the $3,400 support and started a fresh increase. The price traded above $3,500 and the 100 hourly simple moving average. The price faced resistance near the $3,525 level and there was also a connecting bearish trend line formed with resistance near $3,530 on the hourly chart of ETH/USD.
However, on 6 April, Ethereum’s price dived below $3,400. The Ethereum price prediction sees a 4.78% price fall within a few hours of trading as it dropped back to $3,200. The Ethereum price held the $3,200 support level with the possibility of downward movement in the nearest term.
More so, going into the weekend, Ethereum found bids near the $3,140 zone and corrected higher against the US Dollar. ETH price traded as low as $3,143. There was a short-term rising channel forming with resistance near $3,300 on the hourly chart of ETH/USD. There was a break above the $3,200 resistance level. Ether price was able to clear the 23.6% Fib retracement level of the key drop from the $3,550 swing high to $3,143 low.
Ethereum ended the week in the red. The bears were able to push the price down since nailing this week’s high at $3547. On the daily timeframe, ETH dropped towards the daily MA20 (moving average) line after the bulls failed at the significant daily MA200. Now the big question is whether the uptrend is over? The answer to this question is necessary to determine the critical support and resistance levels.

RIPPLE (XRP)
XRP price settled below the supportive trend line at the opening of the week. From the beginning of the month, Ripple’s price has continued south, printing a bullish engulfing candle at $0,82. XRP price continued to consolidate in the $0.80 to $0.85 value area at the beginning of the week.
Ripple price remains at risk of collapse as the circulation of the altcoin, XRP, increases significantly at midweek. Following fixed schedules, the payment giant unlocked 1 billion XRP tokens; 500 million were locked back in escrow accounts.
Going into the weekend, Ripple’s price broke the steady uptrend that it has been since its breakout from the bull pennant on March 11. The pullback, which was a result of BTC’s flash crash, pushed the XRP price to create an equal low at $0.77
More so, amidst crypto’s recent dip, Ripple’s XRP replaces Cardano’s ADA, as XRP’s market volume surpasses that of the latter. The ongoing downtrend has led ADA to move one number downward, as XRP replaces Cardano’s native. Relative to ADA’s $36.68 billion, XRP’s market cap stands at $37.55 billion. Among the top cryptocurrencies by market cap crypto now ranks at number seven, higher than ADA, LUNA, and AVEX.

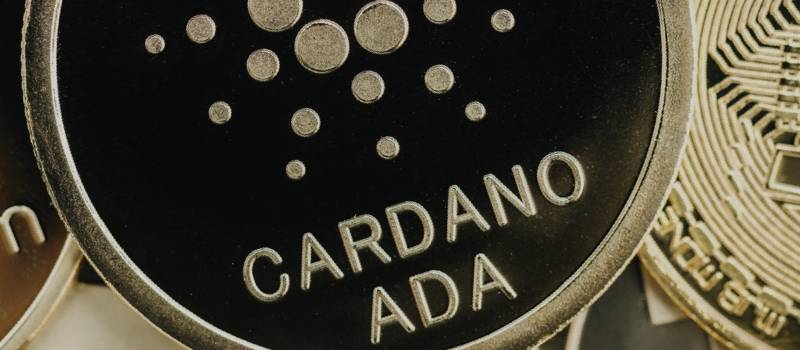
CARDANO (ADA)
When the week opened, Cardano converted into a bull market on its $0.01/3-box reversal point and figure chart. ADA price action developed two possible trade setups for the long and short side of the market. Cardano had recently broken the bear market trendline when ADA moved to $1.20.
On April 6, Cardano (ADA) saw its attempts to pop towards $1.50 being cut short by some bearish comments from a FED official and markets being on edge on new sanctions that could hurt Russia and the global market as a whole. Cardano’s price looked set to top $1.24 and hit new highs in April, but instead got cut short with investors worried about the new sanctions.
However, on April 7, Cardano’s price seems ready to break out with the arrival of bonds on the Ethereum-killer’s Blockchain. Cardano’s price was on a downtrend despite the arrival of new dApps on the Blockchain network. Cardano’s price witnessed a spike in adoption with the rising number of decentralized applications on it. Cardano recently hit a new milestone with 5.1 million holders and a new all-time high in terms of investors on the altcoin network. Before the close of the week, Cardano’s price was heading to $1.6, despite the slowdown of momentum in the Ethereum-killer.
ALTCOINS

SOLANA (SOL)
At the opening of the week, Solana (SOL) price performed a textbook bullish trade setup on Sunday, with price action bouncing off a significant historic pivot level and transforming it into support. Solana price pulled a textbook trading setup with SOL piercing through $130.70. It tested the level for support with a bullish candle resulting in Sunday’s close. As a result of this action, Solana price delivered a bullish calling card to the markets, leading investors to overlook the Relative Strength Index (RSI) trading in overbought.
On Monday, Solana’s price had revealed its bullish intentions as it moved above a crucial resistance barrier. Solanas’s price rallied 88% in under three weeks and set a swing high at $143.53. This move deviated above the existing range that stretches from $80.67 to $121.88.
However, at midweek Solana’s price had declined 17% before Thursday. The price traded at $116 as traders expected choppy countertrend price action before more downslide continues.
At the weekend, Solana price began trading in a distribution zone between $105 and $120. SOL price was on the cusp of breaking back above $130 as the bulls and bears traded against each other in the distribution phase between $105 and $120. Solana price got fired up on Friday in early trading with the Dax storming out of the gates and adding another tailwind to cryptocurrencies, setting a positive tone before the weekend. Additionally, the bulls and bears were ready after exchanging positions and orders in the distribution zone between $105 and $120.
SOL price saw a bullish breakout on Saturday morning after bears were forced to revert to the buy-side to cut their losses while trading in the distribution phase. Expect to see a rally further towards $130.70, where a daily close would set the scene for more gains to come in the new week.

DOGECOIN (DOGE)
DOGE is on the rise on the 7-day average. Dogecoin has risen in price by 1.53% in the last 7 days. It declined by 1.82% in the final 24 hours of the week and further shrunk by 0.41% at the opening hour of Sunday. The price is currently exchanging hands at $0.1462 per DOGE, 80.62% below the all-time high of $0.74.

AVALANCHE (AVAX)
Avalanche was on the decline last week. The price of Avalanche fell by 17.87% in the last 7 days. The price declined by 4.33% in the last 24 hours of the week but grew by 0.34% on Sunday. Before the close of the day, it grew by 0.25%. The current price is $77.79 per AVAX and Avalanche is 45.43% below the all-time high of $146.33.

APECOIN PRICE (APE)
Apecoin is a new coin recently added, an ERS-20 token used with the APE ecosystem, allowing ApeCoin holders to participate in ApeCoin DAO. It is also used to access games, merchandise, events, and services. The price of ApeCoin has fallen by 6.48% in the past 7 days. The price increased by 2.61% going into the weekend but a downtrend says it shrunk by 0.31% on Sunday. The current price is $11.32 per APE.
The post <h5>Digital Asset Insights #61</h5> <h3>Digital Assets Volatility Hits New Highs</h3> appeared first on JP Fund Services.


