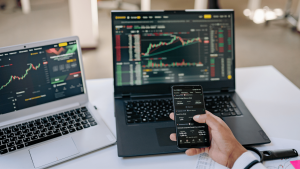
So, you’re thinking about getting into automated trading, huh? It sounds fancy, maybe even a little intimidating, but honestly, it’s more about following a plan. This guide is here to break down how to build your own trading algorithm, step by step. We’ll cover everything from understanding how the markets actually work to making sure your system doesn’t go haywire. Think of it as your roadmap to creating a trading strategy that you can trust, whether you’re just starting out or looking to improve what you already do. Let’s get this done.
Key Takeaways
- Learn the basics of how markets move and why data is so important for making trading decisions.
- Discover how to come up with trading ideas, figure out if they’re good, and set clear rules for when to buy or sell.
- Understand how to test your trading algorithm with past data and make it better before risking real money.
- Find out how to put your trading algorithm to work in live markets and manage your money and risks carefully.
- Explore ways to improve your trading algorithm and keep it working well as markets change.
Foundations Of Algorithmic Trading
Getting started with algorithmic trading can feel like stepping into a whole new world. It’s not just about picking stocks anymore; it’s about building systems that can make those picks for you, based on logic and data. This section is all about laying the groundwork, making sure you’ve got a solid understanding before you start building your own trading machines.
Understanding Market Dynamics
Markets aren’t static. They’re constantly shifting, influenced by everything from global news to the smallest piece of economic data. Think of it like a giant, complex organism that’s always breathing and reacting. To trade algorithmically, you need to grasp what makes this organism tick. What makes prices move? What are the different types of market participants, and how do they interact? Understanding these forces helps you build algorithms that can adapt, rather than just react blindly.
- Supply and Demand: The most basic principle. When more people want to buy something than sell it, the price goes up. The opposite is also true.
- Market Sentiment: This is the overall mood or attitude of investors. Is everyone feeling optimistic and ready to buy, or are they scared and looking to sell?
- Economic Indicators: Things like inflation rates, unemployment figures, and interest rate changes can have a big impact on market direction.
- News and Events: Major political events, company announcements, or even natural disasters can cause sudden price swings.
The financial markets are a complex ecosystem. Success in algorithmic trading comes from understanding the underlying forces that drive price movements, not just observing the movements themselves. It’s about seeing the patterns and understanding the ‘why’ behind the ‘what’.
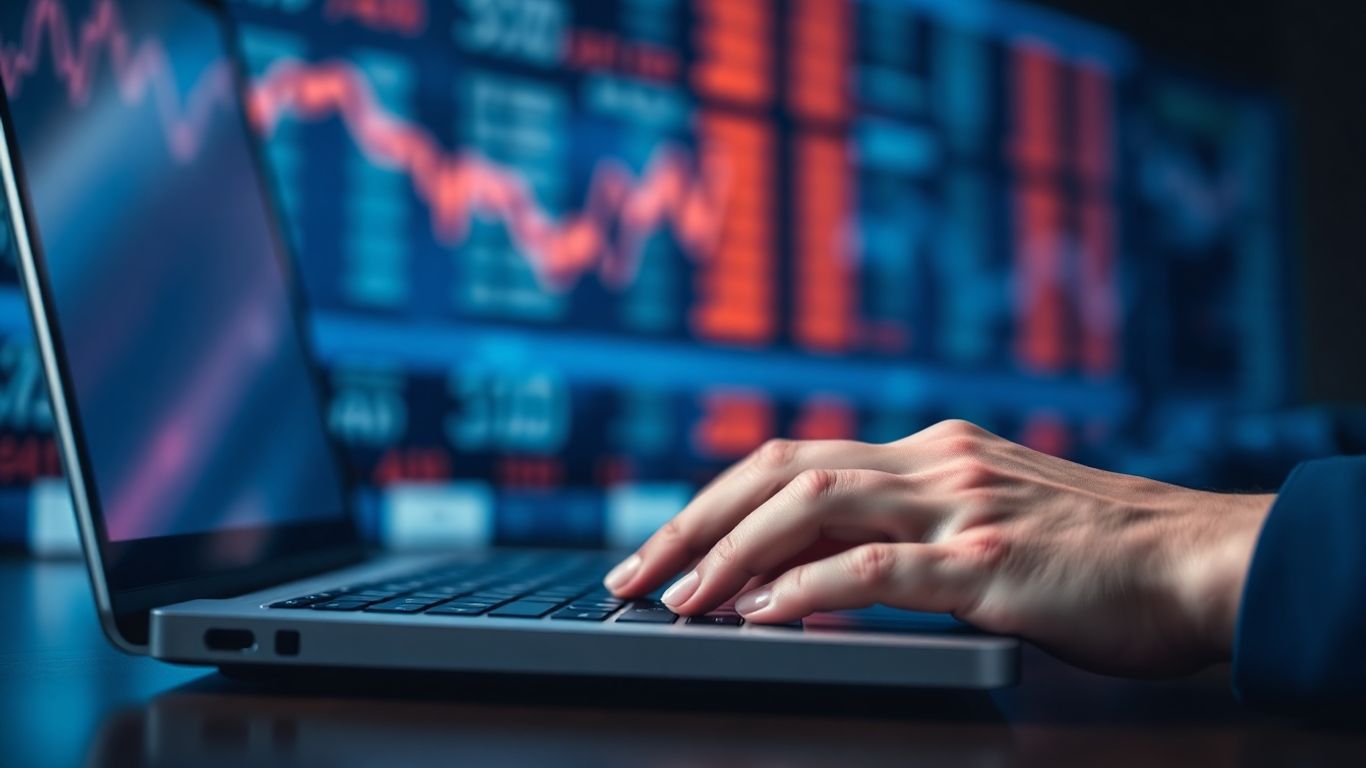
The Role of Data in Trading
Data is the lifeblood of algorithmic trading. Without good data, your algorithms are essentially flying blind. This means not only having access to historical price data but also understanding its quality and how to use it effectively. You’ll be looking at price, volume, and potentially other types of data to find patterns and make decisions. The cleaner and more relevant your data, the better your algorithm will perform.
Here’s a quick look at common data types:
- Price Data: Open, High, Low, Close (OHLC) prices for specific time intervals (e.g., daily, hourly, minute).
- Volume Data: The number of shares or contracts traded during a specific period. High volume can indicate strong conviction behind a price move.
- Fundamental Data: Information about a company’s financial health, like earnings reports and revenue. This is more common for longer-term strategies.
- Alternative Data: This can include anything from satellite imagery of parking lots to social media sentiment. It’s less common but can offer unique insights.
Essential Tools for Algorithm Development
Building trading algorithms isn’t something you can usually do with just a pen and paper. You’ll need a set of tools to help you research, code, test, and deploy your strategies. Think of these as your digital toolkit.
- Programming Language: Python is incredibly popular due to its extensive libraries for data analysis and machine learning (like Pandas, NumPy, and Scikit-learn). R is another option, especially for statistical analysis.
- Development Environment (IDE): This is where you’ll write and manage your code. Popular choices include VS Code, PyCharm, or even Jupyter Notebooks for interactive analysis.
- Backtesting Software: This is critical. It allows you to test your algorithm on historical data to see how it would have performed in the past. Many platforms offer this, or you can build your own.
- Data Providers: You need reliable sources for historical and real-time market data. This could be through your broker, a dedicated data service, or even free sources for basic testing.
- Brokerage API: If you plan to trade live, you’ll need a broker that offers an Application Programming Interface (API) to connect your algorithm to their trading platform.
Developing Your Trading Algorithm
So, you’ve got a trading idea brewing. That’s great! But turning that spark into a working algorithm takes some serious effort. It’s not just about having a good hunch; it’s about building a system that can actually make money in the markets. This section is all about that process, from the initial concept to making sure it’s ready for action.
Idea Generation and Validation
Where do trading ideas even come from? Sometimes it’s a pattern you notice, other times it’s a hunch about how a certain market might behave. You might read about a new economic trend or see something interesting in the news. The key is to capture these thoughts. Keep a journal, a spreadsheet, whatever works for you. Don’t let a potentially good idea slip away.
Once you have an idea, you need to see if it’s actually worth pursuing. This is where validation comes in. You’re looking for evidence that your idea has some merit. This could involve looking at historical price charts, reading market research, or even just talking to other traders. You’re trying to answer the question: ‘Does this idea have a real chance of working?’
Defining Entry and Exit Strategies
This is where you get specific. Your idea might be ‘buy when the price goes up,’ but that’s not enough. You need to define exactly when you’ll enter a trade and, just as importantly, when you’ll get out. This involves setting clear rules.
Here’s a breakdown of what goes into this:
- Entry Triggers: What specific conditions must be met for you to enter a trade? This could be a price level, a moving average crossover, or a specific indicator reading. For example, ‘Enter long when the 50-day moving average crosses above the 200-day moving average.’
- Exit Triggers (Profit Taking): When do you take your profits? This could be a target price, a trailing stop, or a reversal signal. For instance, ‘Exit long when the price reaches 5% above the entry price.’
- Exit Triggers (Stop Loss): This is critical for managing risk. At what point do you cut your losses if the trade goes against you? A common method is a fixed percentage stop loss, like ‘Exit long if the price drops 2% below the entry price.’
Backtesting and Optimization Techniques
Now for the fun part: testing your strategy on historical data. This is called backtesting. You’re essentially simulating how your algorithm would have performed in the past. This gives you a realistic look at its potential profitability and risks.
Here’s a typical backtesting process:
- Gather Data: Get reliable historical price data for the markets you plan to trade.
- Code Your Strategy: Translate your entry and exit rules into code that a computer can understand.
- Run the Simulation: Let the code run through the historical data, recording every simulated trade.
- Analyze Results: Look at metrics like total profit, win rate, maximum drawdown, and profit factor. This is where you see if your idea actually holds water.
Backtesting is a powerful tool, but it’s not foolproof. You can easily fall into the trap of ‘overfitting,’ where your strategy works perfectly on past data but fails in live trading because it’s too tailored to historical quirks. Always be wary of strategies that look too good to be true on historical charts.
Optimization is the next step. This involves tweaking the parameters of your strategy (like the moving average periods or profit targets) to see if you can improve its performance. However, be careful not to optimize too much. You want a robust strategy, not one that’s just lucky on past data. Think about how you can find a good trading system that balances performance with resilience.
Implementing Your Trading System
So, you’ve gone through the whole process: you’ve got an idea, you’ve tested it like crazy, and it looks like it might actually make some money. That’s awesome! But now comes the really tricky part – actually putting your algorithm to work in the real market. This isn’t just about hitting ‘go’ and watching the profits roll in. It’s about making sure your system can handle the chaos of live trading without blowing up your account.
From Simulation to Live Trading
Moving from a backtested simulation to live trading is a big leap. Think of it like going from practicing a sport in your backyard to playing in a championship game. The environment is different, the pressure is on, and unexpected things happen. Your simulation might have looked perfect, but the live market has slippage, news events, and other traders to deal with. It’s important to start small when you first go live. Don’t throw your entire capital at it right away. Maybe start with a small portion of your intended position size, or even paper trade for a bit longer if you’re feeling nervous. This lets you see how your algorithm behaves with real money on the line, but with less risk.
Position Sizing and Risk Management
This is where you protect yourself. Even the best trading algorithm can have losing streaks. Proper position sizing is your first line of defense against significant losses. It’s not just about how much you invest in a single trade, but how that trade fits into your overall portfolio and risk tolerance. You need rules for how much capital to allocate to each trade based on its risk, and how much you’re willing to lose on any given day or week. This prevents one bad trade, or even a series of bad trades, from wiping you out.
Here’s a basic way to think about it:
- Determine your maximum risk per trade: This is usually a small percentage of your total trading capital, like 1% or 2%.
- Calculate your stop-loss level: Based on your algorithm’s entry and exit rules, figure out where you’ll exit a losing trade.
- Calculate position size: Use the distance between your entry price and stop-loss to determine how many shares or contracts you can trade while staying within your maximum risk per trade.
For example, if you have a $10,000 account and decide to risk 1% per trade ($100), and your stop-loss is $0.50 away from your entry price, you could buy 200 shares ($100 / $0.50 = 200).
Monitoring and Adjusting Your Algorithm
Markets change, and so do the conditions your algorithm was designed for. What worked last year might not work today. You can’t just set it and forget it. You need to keep an eye on how your algorithm is performing. Are the results matching your backtests? Are there any new patterns emerging that your algorithm isn’t catching? Regular performance reviews are key. This doesn’t necessarily mean you have to constantly tweak your code, but you do need to be aware of when your system might be starting to drift or when it’s time to consider adjustments or even retiring it.
The transition from a simulated environment to live trading introduces a host of real-world variables that can impact performance. Slippage, latency, and unexpected market events are just a few of the factors that can cause live results to diverge from backtested expectations. Therefore, a phased approach to deployment, coupled with robust risk management protocols, is paramount for preserving capital and building confidence in your automated strategy.
It’s a continuous cycle. You implement, you monitor, you analyze, and then you decide if adjustments are needed. This ongoing process is what separates systems that survive from those that fade away.
Advanced Algorithmic Strategies
Once you’ve got a solid trading algorithm humming along, it’s time to think about how to really push the envelope. This isn’t just about making more money; it’s about finding those little edges that others miss and making your system smarter. We’re talking about strategies that go beyond the basics, digging into the nitty-gritty of market behavior.
Exploiting Market Inefficiencies
Markets aren’t always perfectly efficient. Sometimes, prices don’t immediately reflect all available information. This creates opportunities. Think about it: if a stock suddenly drops on news that turns out to be false, there’s a brief window where its price is too low. An algorithm can spot this much faster than a person.
- Arbitrage: This is the classic example. It involves buying an asset in one market and simultaneously selling it in another to profit from a price difference. While pure arbitrage is rare and fast, variations exist.
- Statistical Arbitrage (Stat Arb): This is more common. It looks for temporary mispricings between related assets, like two stocks in the same industry or a stock and its ETF. The idea is that these prices will eventually converge.
- Event-Driven Strategies: These algorithms are designed to react to specific news or corporate events, like earnings announcements or mergers. They try to predict the market’s reaction and trade accordingly.
The key here is speed and accuracy. You need systems that can identify these inefficiencies and act before the rest of the market catches on. It’s like being the first one to know a secret.
Leveraging Statistical Tendencies
Markets, despite their complexity, often exhibit predictable patterns based on statistics. These aren’t guarantees, but they’re tendencies that can be exploited. Identifying and trading these statistical quirks is a cornerstone of advanced algorithmic trading.
Here are a few common tendencies:
- Mean Reversion: Many assets tend to move back towards their average price over time. Algorithms can identify when an asset has moved too far from its average and bet on it returning.
- Momentum: Conversely, sometimes assets that are moving in a certain direction tend to keep going. Algorithms can identify strong trends and ride them for a while.
- Seasonality: Certain markets or assets might show patterns based on the time of year, month, or even day. For example, some commodities might be more expensive in winter.
| Strategy Type | Description |
|---|---|
| Mean Reversion | Trades against the current trend, expecting a return to the average price. |
| Momentum | Trades with the current trend, expecting it to continue. |
| Seasonality | Trades based on predictable patterns related to time (year, month, day). |
Adapting to Evolving Market Patterns
Markets are not static. What worked yesterday might not work tomorrow. This is perhaps the biggest challenge. Your algorithms need to be able to adapt. This means constantly monitoring performance and being ready to tweak or even replace strategies.
- Regime Detection: Algorithms can try to identify different market conditions (e.g., high volatility, low volatility, trending, range-bound) and adjust their trading approach accordingly.
- Adaptive Parameters: Instead of fixed rules, some algorithms adjust their parameters (like moving average lengths or stop-loss distances) based on current market conditions.
- Ensemble Methods: Combining multiple different algorithms or strategies can often lead to more robust performance than relying on a single one. If one strategy is having a bad day, others might pick up the slack.
It’s a continuous cycle of observation, analysis, and adjustment. The goal is to build systems that aren’t just smart, but also resilient to change.
The Psychology of Algorithmic Trading

Even with the most solid algorithm, the human element can still trip you up. Trading, even automated trading, plays with your head. It’s easy to get caught up in the wins and losses, letting emotions cloud your judgment. This section is all about keeping your cool and staying on track.
Overcoming Behavioral Biases
We all have mental shortcuts that can lead us astray. In trading, these biases can cost you money. Think about it: you might hold onto a losing trade too long, hoping it’ll turn around (loss aversion), or you might get overly confident after a few good trades and take on too much risk (overconfidence bias).
Here are some common ones to watch out for:
- Confirmation Bias: Looking for information that supports your existing beliefs about a trade, ignoring anything that contradicts it.
- Anchoring Bias: Getting stuck on a specific price level, even when market conditions change.
- Recency Bias: Giving too much weight to recent events, like a big win or loss, and letting it unfairly influence your next decision.
- Herding Behavior: Following the crowd, even if your own analysis suggests otherwise.
Recognizing these biases is the first step to fighting them. You need to actively question your own thinking and stick to your trading plan, no matter what.
Maintaining Discipline in Automated Trading
Automated trading is supposed to remove emotion, right? Well, mostly. But the temptation to interfere with your algorithm is still there. You see a trade go against you for a moment, and your gut screams to shut it down. Or maybe it’s on a winning streak, and you feel like you should add more money, even if it’s outside your risk parameters.
- Stick to the Plan: Your algorithm is built on logic. Don’t override it based on a feeling.
- Set Rules for Intervention: Decide in advance under what specific, rare circumstances you might manually intervene. This could be a system-wide failure or a major news event that invalidates your algorithm’s assumptions.
- Review Performance Logically: When you review trades, do it after the fact, with data, not in the heat of the moment.
The real test of discipline isn’t just following your algorithm when it’s winning, but trusting it when it’s facing a drawdown. That’s where most traders falter.
The Mindset of Continuous Learning
Markets change. What worked yesterday might not work tomorrow. Your algorithm needs to adapt, and so do you. This isn’t a set-it-and-forget-it game. You need to be in a constant state of learning and refinement.
- Regular Performance Reviews: Don’t just look at profit and loss. Analyze why trades worked or didn’t work.
- Stay Informed: Keep up with market news and economic shifts that could impact your strategies.
- Experiment and Iterate: Be willing to tweak your algorithm, test new ideas, and even retire strategies that are no longer effective.
Think of yourself as a scientist. You have a hypothesis (your algorithm), you test it, you analyze the results, and you refine your approach. This ongoing process is what separates those who succeed long-term from those who don’t.
Wrapping It Up
So, we’ve gone through a lot, right? Building a trading algorithm isn’t exactly a walk in the park. It takes time, some serious thinking, and a willingness to learn from mistakes – and trust me, there will be mistakes. But by sticking to the steps we’ve talked about, focusing on solid logic, and always keeping an eye on how the market shifts, you’re setting yourself up for a much better chance at success. Remember, this isn’t a get-rich-quick thing. It’s about building something smart, testing it thoroughly, and being ready to adjust when things change. Keep learning, keep refining, and you’ll be well on your way to mastering the markets with your own system.
Frequently Asked Questions
What exactly is algorithmic trading?
Algorithmic trading is like using a super-smart computer program to make trading decisions for you. Instead of you watching the market all day, the program follows a set of instructions (an algorithm) to buy or sell stocks automatically when certain conditions are met. It’s all about speed and logic!
Do I need to be a math whiz to create a trading algorithm?
You don’t need to be a genius! While math helps, the most important thing is understanding how the market works and how to set clear rules for your program. Many tools and resources can help you build your algorithm without needing advanced math skills.
How do I know if my trading idea will actually make money?
Before you risk real money, you test your idea using past market data. This is called ‘backtesting.’ It’s like running a practice game to see how your strategy would have performed before. You also ‘optimize’ it to make it even better.
What’s the difference between testing an algorithm and using it for real?
Testing is like practicing in a simulator. Using it for real means putting your actual money on the line. You have to be very careful with how much money you use for each trade (position sizing) and always protect yourself from big losses (risk management).
Can my trading algorithm keep making money forever?
Markets change, so your algorithm might need updates. What works today might not work tomorrow. It’s important to keep an eye on how your algorithm is doing and be ready to adjust it or create new ones to keep up with the changing market.
Will my emotions get in the way if I use an algorithm?
Even with an algorithm, your feelings can still cause problems. You might get scared during a market dip or too excited after a big win. Staying disciplined and sticking to your plan, even when it’s tough, is super important for success.