


In the previous lesson, we talked about the importance of using stop losses, and explained the simplest method for selecting a stop loss level, namely equity (or percentage) stops – and the potential problems with this approach. Today, we’ll be talking about some of the alternative methods of setting stop losses, starting with what’s known as a ‘chart stop’.
Chart Stops
Rather than setting your stop loss based purely on how much you can afford to risk, it can be more useful to base it on what the charts are telling you. One of the things that we can often see in price action is that prices often can’t seem to break beyond certain levels. In many cases, if these support or resistance levels are tested more than once, they can prevent the market from pushing through them in subsequent tests.
Therefore, it makes sense to set stops beyond these levels of resistance and support, as a breakout will encourage more buyers or sellers into the market, potentially pushing the position further against you. If these levels do break, it can often be caused by forces that you are unaware of (at least at the time) pushing the market in one direction or the other.
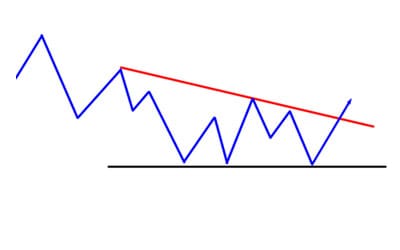
In the chart diagram above, we can see that the price has broken through the falling trend line (red). Deciding that this is a good setup for a breakout trade, you decide to go long. This leaves you with the question of where to set your stop, and the conditions in which your original trade idea would be invalidated.
In this instance, it makes sense to put your stop below the support areas and trend lines, as if the price moves into these areas, it meant that the trend lines failed to draw support from buyers, and that sellers are now in control. This invalidates your trade idea, making it a good point to exit the trade and cut your losses.
Volatility Stop
Volatility is a measure of how much a market can move over a period of time. A knowledge of how much a currency pair is likely to move can aid you is selecting a stop loss level and avoid getting stopped out due to short term fluctuations in price.
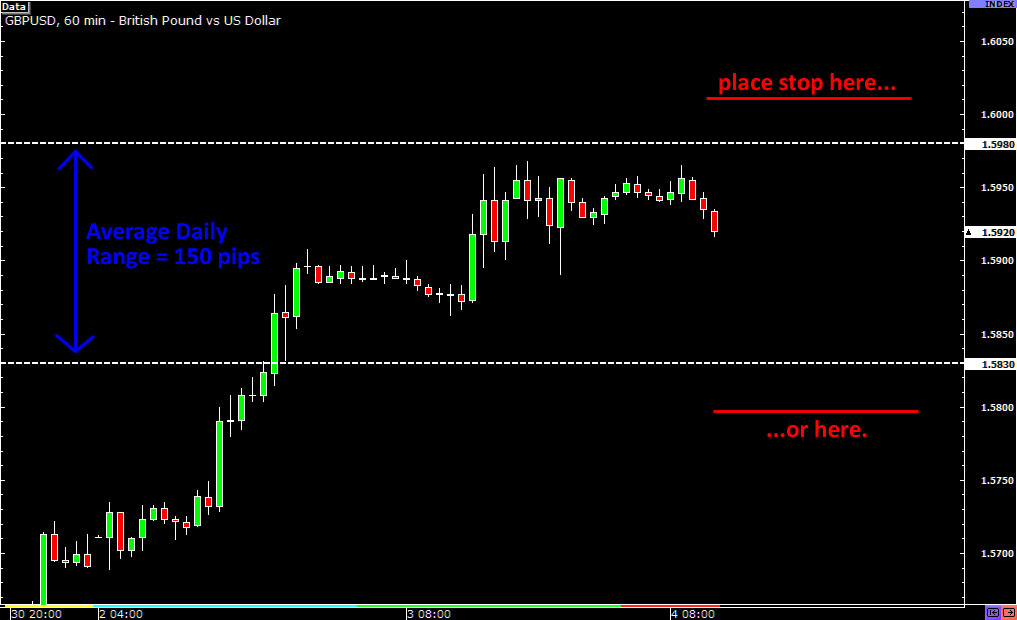
For example, if you are involved in a longer-term swing trade and the pair you are trading has moved around 100 pips a day in the past month – as in our example in the previous lesson – a 20-pip stop will probably result in you getting stopped out too early due to a small intraday move. If you know the average volatility, you can set stops that give your trade room to breathe – and give it a chance to be right.
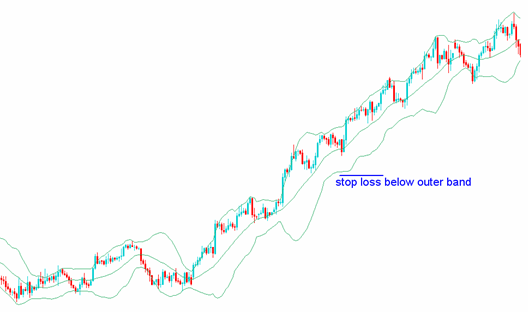
One of the best ways to measure volatility is to use Bollinger Bands, and they can be useful for setting stops too – simply set your stop beyond the range of these bands as in the chart below. If the price hits this level, it means that volatility is on the increase, and you could be witnessing a breakout in progress.
The Average True Range (ATR) indicator is another useful tool for measuring volatility. This common indicator requires you to enter the ‘period’ (amount of bars/candlesticks etc) that it will look back through to work out the average range.
So, if you used a period of 20 on a daily chart, the ATR will indicate the average range for the pair over the past 20 days. Or, if you were using an hourly chart and a period of 48, you would get the average for the last 48 hours. You could then use this information to set your stop loss level, as in the chart below.
It could also be used in conjunction with other stop loss techniques – after all, the aim is to give your trade room to breathe, without getting caught out by fluctuations.
Tradersdna is a leading digital and social media platform for traders and investors. Tradersdna offers premiere resources for trading and investing education, digital resources for personal finance, market analysis and free trading guides. More about TradersDNA Features: What Does It Take to Become an Aggressive Trader? | Everything You Need to Know About White Label Trading Software | Advantages of Automated Forex Trading


